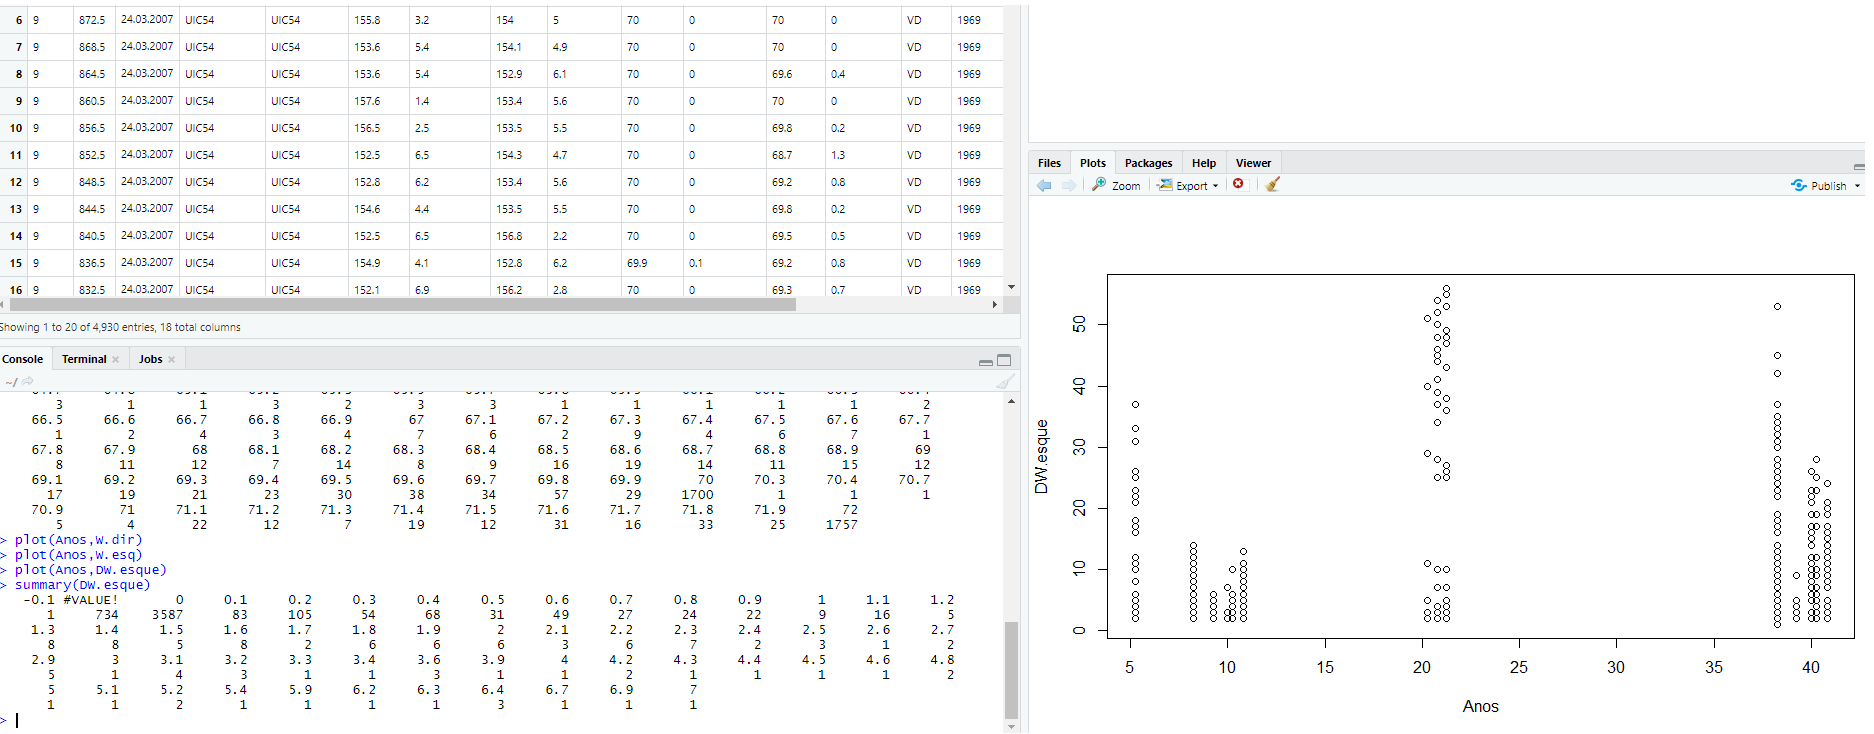
Hello everyone...I started working with R studio few days ago and I'm having some problems in plotting some data. I already imported data from excel and when plotting it the graph shows me values i don't have. The max values I have in that specific variable is like 7 and it it plotting me values until 50. Can anyone help me?
To help us help you, could you please prepare a reproducible example (reprex) illustrating your issue? Please have a look at this guide, to see how to create one: