Hi
I'm writing my PhD thesis (involving a lot of MR imaging), and would like to create figures with ggplot to display some basic principles of MR physics like the Bloch equations for T1 and T2. I've tried Googling but haven't come across what I (think) I'm looking for...
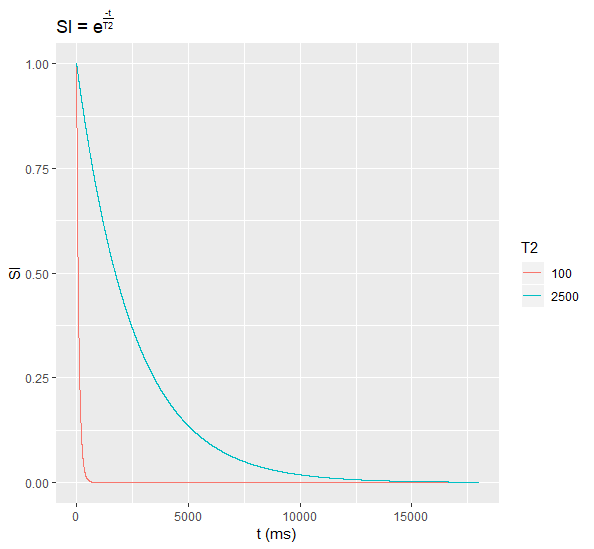
Is there a way to plot just a mathematical function without data points? E.g. SI = e-t/T2 where SI is signal intensity in a tissue, t is time in ms and T2 is T2 decay time in ms (time taken for 63% "signal loss", e.g. ~ 2500 ms for water and ~ 100 ms for white matter).
Please let me know if you need more context, and thank you for any help!
Hi Brage, if I understand you correctly, the way to do what you're talking about is just to use dummy data. Here's what I would do (if I've misunderstood your motives, please let me know).
library(tidyverse)
library(latex2exp) #For showing the equation in the title of the plot.

# Create a dataframe for a series t from 1 to 18.000
dataf <- tibble(t = 1:18e3) %>%
  mutate(water = 2500, #input the data for water
         white_matter = 100) %>%  #input the data for white matter
  gather(-t, key = "tissue_material", value = "T2") %>% #Tidy data for plotting
  mutate(si = exp(-(t/T2))) #We use the exp() function for e

dataf %>%
  ggplot(aes(x = t, y = si, color = factor(T2))) +
  geom_path() +
  labs(title = TeX("SI = e^{\\frac{-t}{T2}}"),
       color = "T2",
       y = "SI",
       x = "t (ms)")
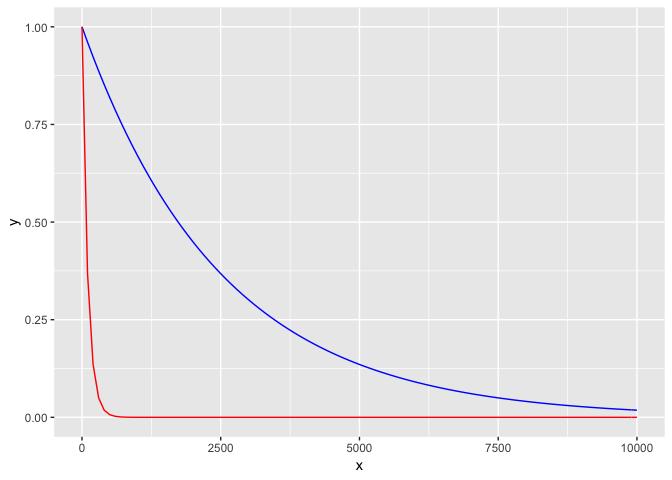
However, I think if you are plotting more than two lines from a formula, I think something like @Hlynur's approach is more idiomatic as it more naturally allows you to adjust the line's properties (colour etc).