I need some help with plotting a function with geom_function.
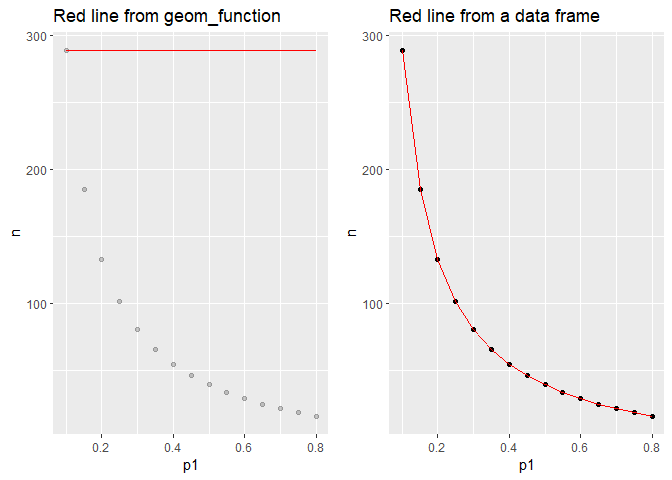
I want to plot, for different risk ratio RR, the sample size n1 vs the proportion p1 for a two proportions test. I modify the function hmisc::bsamsize as below and want to use geom_function to plot the curve.
The problem is that I got a horizontal line instead of the red curve (on the right hand side). I think the problem is that f.test function is not vectorized. What is the correct way to do it?
Thanks in advance.
Ha Nguyen
I am sorry, wrong pasting.
Ha
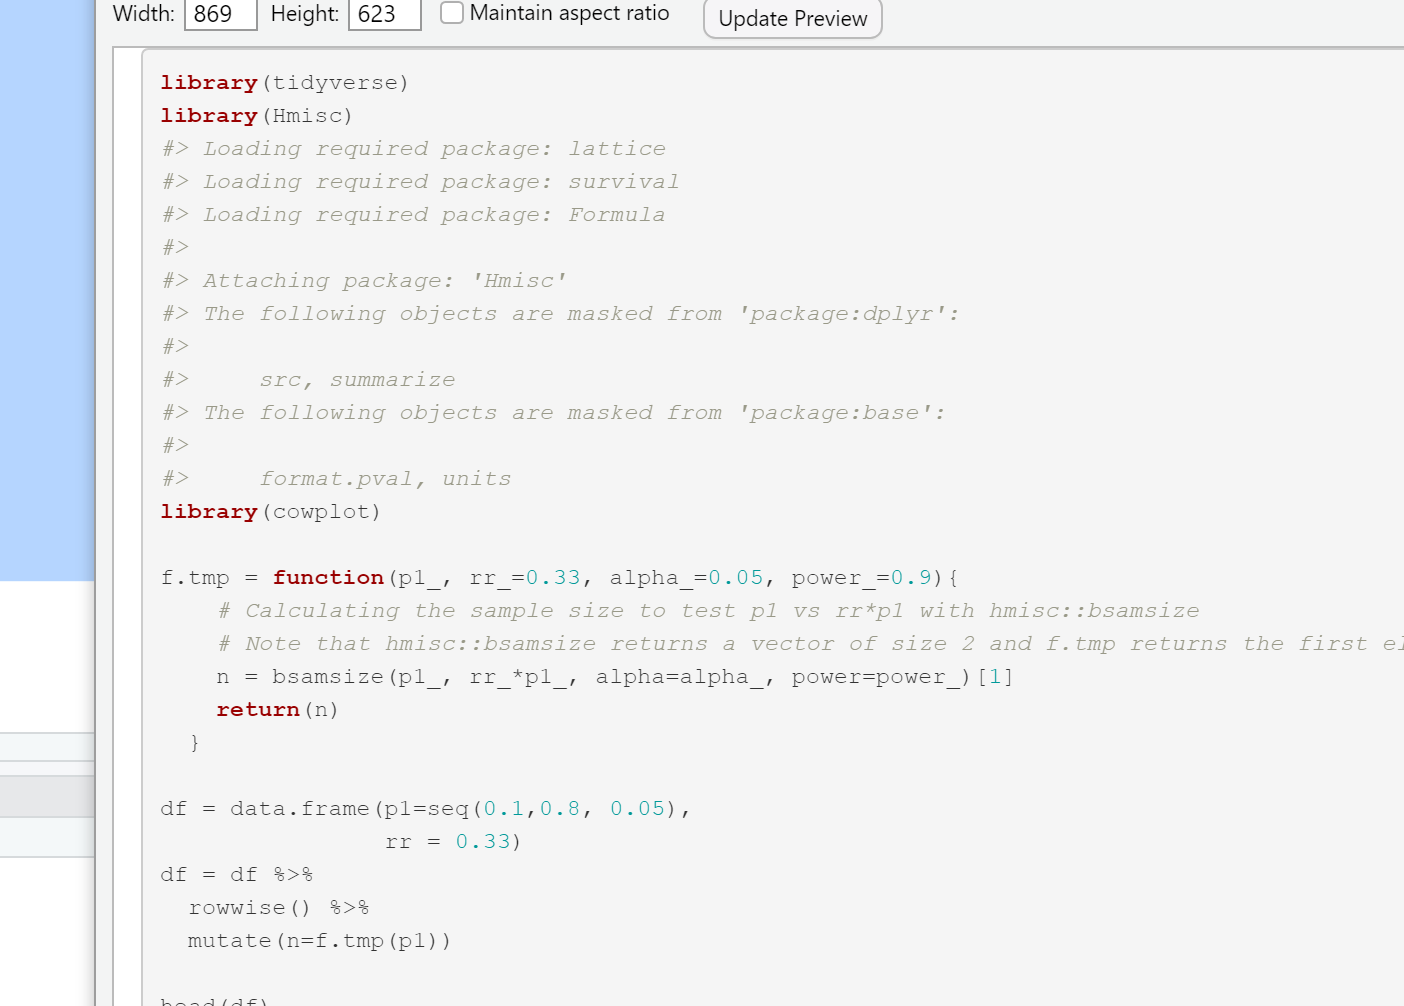
library(tidyverse)
library(Hmisc)
#> Loading required package: lattice
#> Loading required package: survival
#> Loading required package: Formula
#>
#> Attaching package: 'Hmisc'
#> The following objects are masked from 'package:dplyr':
#>
#>     src, summarize
#> The following objects are masked from 'package:base':
#>
#>     format.pval, units
library(cowplot)

f.tmp = function(p1_, rr_=0.33, alpha_=0.05, power_=0.9){
    # Calculating the sample size to test p1 vs rr*p1 with hmisc::bsamsize
    # Note that hmisc::bsamsize returns a vector of size 2 and f.tmp returns the first elelement
    n = bsamsize(p1_, rr_*p1_, alpha=alpha_, power=power_)[1]
    return(n)
  }

df = data.frame(p1=seq(0.1,0.8, 0.05),
                rr = 0.33)
df = df %>%
  rowwise() %>%
  mutate(n=f.tmp(p1))

head(df)
#> # A tibble: 6 x 3
#> # Rowwise:
#>      p1    rr     n
#>   <dbl> <dbl> <dbl>
#> 1  0.1   0.33 289.
#> 2  0.15  0.33 185.
#> 3  0.2   0.33 133.
#> 4  0.25  0.33 102.
#> 5  0.3   0.33  81.0
#> 6  0.35  0.33  66.1

tmpplot2 = ggplot(df, aes(x=p1, y=n)) +
  geom_point()+
  geom_line(col='red')+
  ggtitle('Red line from a data frame')

tmpplot1 = ggplot(df, aes(x=p1, y=n)) +
  geom_point(alpha=.2)+
  geom_function(fun="f.tmp", color='red')+
  ggtitle('Red line from geom_function')


plot_grid(tmpplot1, tmpplot2)
Created on 2021-02-06 by the reprex package (v0.3.0)
DavoWW
February 7, 2021, 7:57am
3
Hi @Wobniar ,help(Vectorize)
So, this works:
  geom_point(alpha=.2)+
  geom_function(fun=Vectorize("f.tmp"), color='red')+
  ggtitle('Red line from geom_function')
Hi @DavoWW , thank you very much. I am not aware of the function Vectorize and learn about an useful one today.
Best.
Ha
system
February 28, 2021, 4:44pm
5
This topic was automatically closed 21 days after the last reply. New replies are no longer allowed.