I've got a problem with the following regression models. I want to get two polynomial regression lines and one linear regression line on the same scatter plot. In addition, i want to show the equations for the three different models on the same graph using ggpmisc package.
I've coded my problem as follows:
library(tidyverse)
library(ggpmisc)
equation <- y ~ x

df %>%
  filter(Year == 2010) %>%
  ggplot(aes(x = commutetime, y = carcommute, color=Fabric, shape = Fabric)) +
  geom_point() +
  theme_minimal()+
  geom_point(size = 3.5, aes(color = Fabric, shape = Fabric))+
  stat_smooth(method = "lm", formula = y ~ poly(x, 2), size = 1, se = FALSE)+
  scale_color_manual(values = c("#00AFBB", "#E7B800", "#FC4E07"))+
  scale_fill_manual(values = c("#00AFBB", "#E7B800", "#FC4E07"))+
  stat_poly_eq(aes(label = paste(..eq.label.., ..rr.label.., sep = "~~~")),
               label.x.npc = "center", label.y.npc = 0.39,
               formula = equation, parse = TRUE, size = 5)
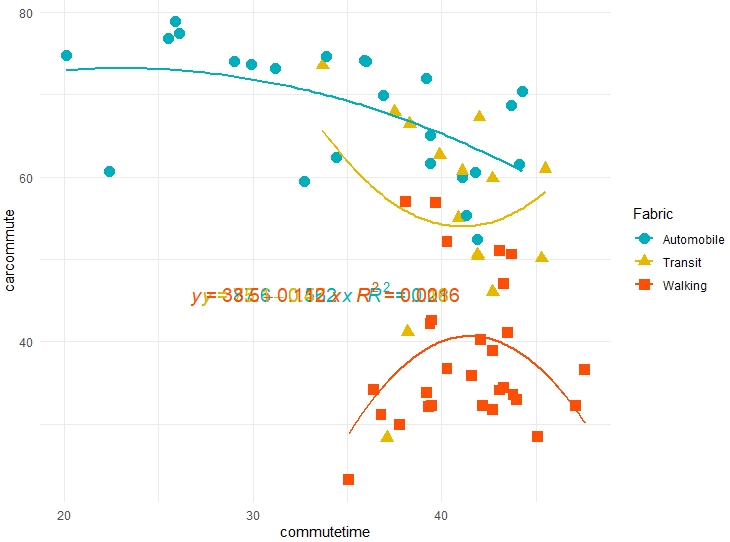
But i am getting the graph below my data : Automobile and Walking fabrics should reflect the quadratic regression while Transit should show decreasing trend as commute time increases. That means i want transit to be straight line and keep the quadratic regression for both automobile and walking. Any idea of how i can modify my code to show that.
Similarly my equations for the three models overlap? How can i solve this? Thank you very much in advance!!!
Here's my data:
  carcommute commutetime  Fabric
3         35.9        41.6    Walking
4         84.0        34.9    Walking
7         28.3        37.1    Transit
8         82.6        31.4    Transit
11        23.3        35.1    Walking
12        63.0        30.3    Walking
15        34.2        36.4    Walking
16        80.7        29.3    Walking
19        31.1        36.8    Walking
20        76.1        33.1    Walking
23        29.9        37.8    Walking
24        78.4        33.2    Walking
27        32.2        39.5    Walking
28        79.8        35.2    Walking
31        31.7        42.7    Walking
32        82.9        38.6    Walking
35        34.1        43.1    Walking
36        79.7        37.6    Walking
39        28.5        45.1    Walking
40        76.3        39.3    Walking
43        32.2        47.1    Walking
44        81.9        38.5    Walking
47        36.6        47.6    Walking
48        85.5        41.3    Walking
51        34.4        43.3    Walking
52        83.3        38.6    Walking
55        36.7        40.3    Walking
56        91.0        35.4    Walking
59        33.8        39.2    Walking
60        82.5        31.4    Walking
63        47.0        43.3    Walking
64        89.9        36.8    Walking
67        41.1        43.5    Walking
68        87.8        39.1    Walking
71        33.6        43.8    Walking
72        90.4        35.7    Walking
75        38.9        42.7    Walking
76        86.7        36.4    Walking
79        32.1        39.3    Walking
80        84.4        31.9    Walking
83        32.2        42.2    Walking
84        88.7        35.3    Walking
87        32.9        44.0    Walking
88        87.5        36.4    Walking
91        41.2        38.2    Transit
92        89.1        31.5    Transit
95        42.6        39.5    Walking
96        87.6        30.3    Walking
99        42.2        39.4    Walking
100       84.2        33.5    Walking
103       40.2        42.1    Walking
104       88.5        31.0    Walking
107       59.9        41.1 Automobile
108       76.9        35.9 Automobile
111       59.4        32.7 Automobile
112       75.8        32.5 Automobile
115       57.0        38.1    Walking
116       67.1        35.8    Transit
119       56.9        39.7    Walking
120       76.2        33.0    Walking
123       67.9        37.5    Transit
124       78.7        36.0    Transit
127       60.7        41.1    Transit
128       75.2        38.6    Transit
131       50.6        43.7    Walking
132       81.5        37.9    Walking
135       61.0        45.5    Transit
136       76.5        38.8    Transit
139       67.2        42.0    Transit
140       83.5        36.8    Transit
143       60.7        22.4 Automobile
144       49.7        17.5 Automobile
147       70.4        44.3 Automobile
148       87.4        22.7 Automobile
151       61.6        39.4 Automobile
152       80.1        41.4 Automobile
155       62.7        39.9    Transit
156       79.6        42.1    Transit
175       50.4        41.9    Transit
176       67.0        44.7    Transit
191       50.1        45.3    Transit
192       83.1        43.8    Transit
195       51.0        43.1    Walking
196       75.1        43.4    Walking
207       52.1        40.3    Walking
208       78.3        47.3    Walking
223       46.0        42.7    Transit
224       77.7        45.9    Transit
227       74.0        29.0 Automobile
228       80.7        29.7 Automobile
231       62.4        34.4 Automobile
232       88.1        45.9 Automobile
235       66.4        38.3    Transit
236       81.6        44.0    Transit
247       59.8        42.7    Transit
248       81.5        49.2    Transit
267       52.4        41.9 Automobile
268       83.6        46.6 Automobile
271       55.0        40.9    Transit
272       80.5        42.8    Transit
275       61.5        44.1 Automobile
276       82.3        40.7 Automobile
279       73.5        33.7    Transit
280       89.5        35.8    Transit
283       74.0        36.0 Automobile
284       81.8        42.0 Automobile
287       50.6        41.9    Transit
288       79.0        50.1    Transit
291       60.5        41.8 Automobile
292       82.8        46.2 Automobile
295       55.3        41.3 Automobile
296       77.8        43.0 Automobile
299       68.7        43.7 Automobile
300       82.1        44.2 Automobile
315       69.9        36.9 Automobile
316       86.6        40.1 Automobile
319       78.9        25.9 Automobile
320       73.9        30.1 Automobile
323       76.8        25.5 Automobile
324       76.3        29.1 Automobile
327       72.0        39.2 Automobile
328       86.4        45.7 Automobile
331       74.1        35.9 Automobile
332       86.3        33.8 Automobile
335       74.6        33.9 Automobile
336       78.6        40.4 Automobile
339       65.0        39.4 Automobile
340       90.5        39.6 Automobile
343       73.2        31.2 Automobile
344       79.0        30.7 Automobile
351       73.6        29.9 Automobile
352       63.0        27.3 Automobile
355       74.7        20.1 Automobile
356       72.7        31.9 Automobile
359       77.4        26.1 Automobile
360       79.2        29.4 Automobile
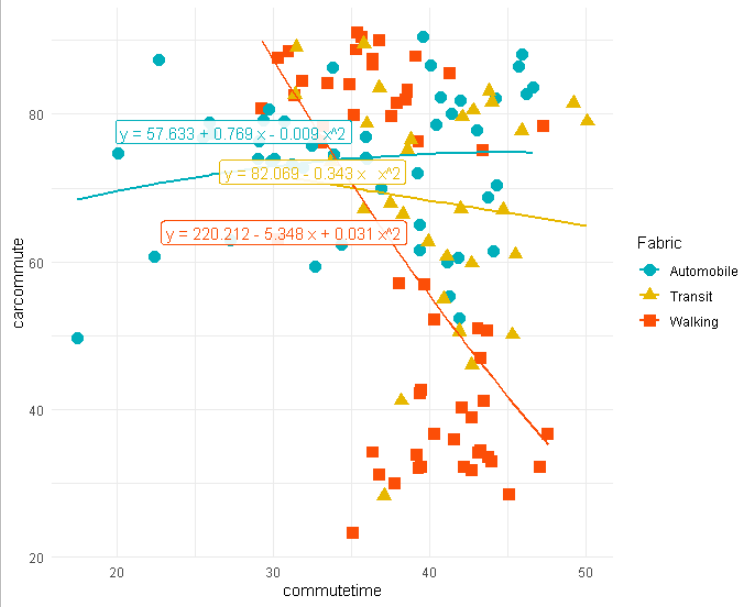
You can also have a look at my graph. Thank you very much in advance!!!