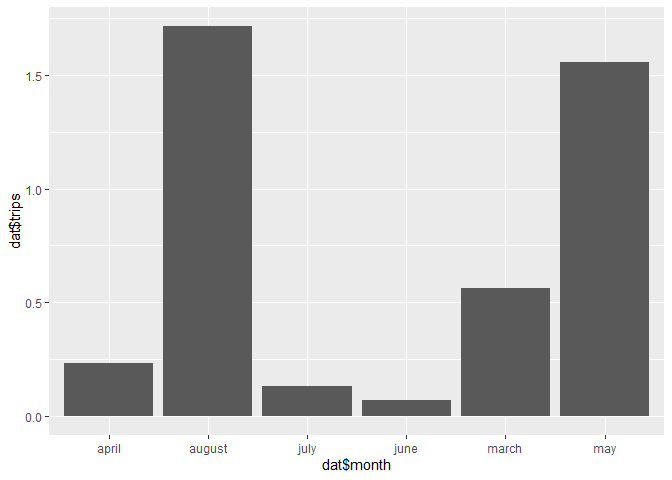
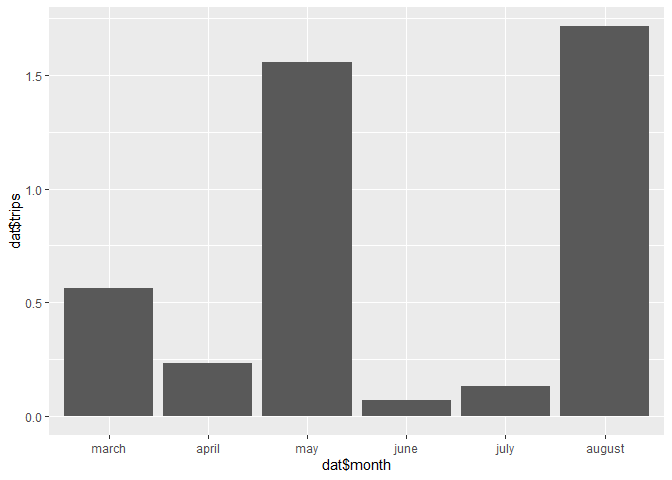
Turn month into a factor variable and use the levels to set the order
# Sample data on a copy/paste friendly format, replace this with your own data frame
dat <- data.frame(
stringsAsFactors = FALSE,
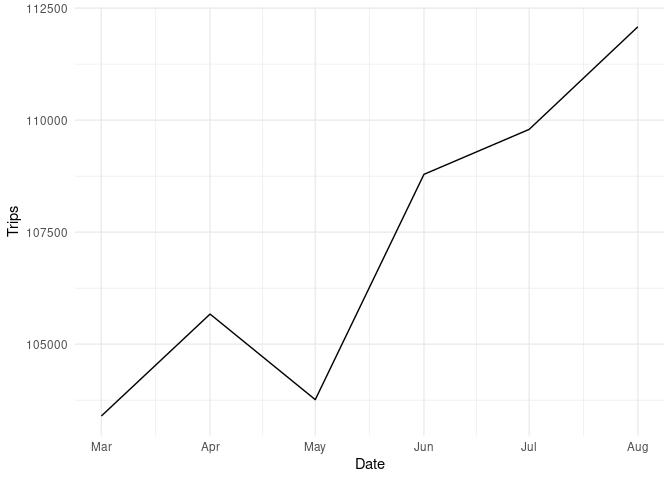
Month = c("March", "April", "May", "June", "July", "August"),
Trips = c(103397, 105672, 103762, 108791, 109794, 112084),
Missed = c(1636, 2043, 2464, 3642, 3706, 4148),
Early = c(483, 407, 465, 481, 461, 491),
Late = c(1287, 1057, 848, 883, 931, 1024),
Runs = c(11070, 10664, 10691, 10664, 11014, 10816),
Closed = c(2629, 2701, 2794, 3181, 3521, 3401),
Revenue = c(992142, 997744, 952024, 940950, 875145, 898512),
VOM = c(311, 321, 304, 298, 284, 284),
VAM = c(485, 494, 505, 207, 507, 507)
)
Sys.setlocale("LC_ALL","en_US.UTF-8") # Not needed if you are using an English locale
#> [1] "LC_CTYPE=en_US.UTF-8;LC_NUMERIC=C;LC_TIME=en_US.UTF-8;LC_COLLATE=en_US.UTF-8;LC_MONETARY=en_US.UTF-8;LC_MESSAGES=es_PE.UTF-8;LC_PAPER=es_PE.UTF-8;LC_NAME=C;LC_ADDRESS=C;LC_TELEPHONE=C;LC_MEASUREMENT=es_PE.UTF-8;LC_IDENTIFICATION=C"
dat$Month <- factor(dat$Month, levels = format(ISOdate(2004,1:12,1),"%B"))
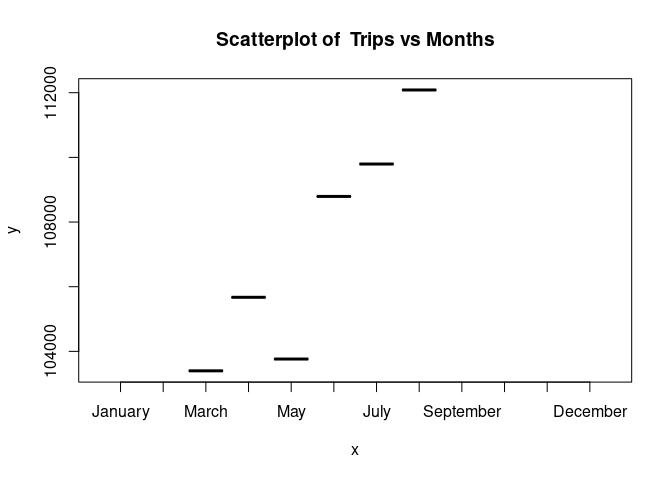
attach(dat)
plot(Month,Trips, main="Scatterplot of Trips vs Months")
Created on 2021-12-28 by the reprex package (v2.0.1)
Note: Next time please provide a proper REPRoducible EXample (reprex) illustrating your issue.