Hi guys!
I just started learning R and i’ve run into something that I can’t solve.
My problem is the following: I have a time series of daily return on a stock. I have used ghyp package to fit my daily returns to a hyperbolic distribution. Now I want to plot density of that hyperbolic distribution (eg. NIG).
I want to do my plot using ggplot but the ggplot can’t read ghyp package.
Would appreciate any advice.
Could you ask this with a minimal REPRoducible EXample (reprex)? A reprex makes it much easier for others to understand your issue and figure out how to help.
If you've never heard of a reprex before, you might want to start by reading this FAQ:
Could you say more about what you mean by this (or, better yet, as suggested, include a small example)? From a quick look at the ghyp documentation, it seems like several base plotting methods are in there. You should be able to recreate these using ggplot2, it's a matter of having your data in a certain format (e.g. a data frame).
So, assuming you there is a dghyp function in the ghyp package and you obtain parameters for your hyperbolic distribution from your fitting process, I think you should be able to pretty much follow that pattern.
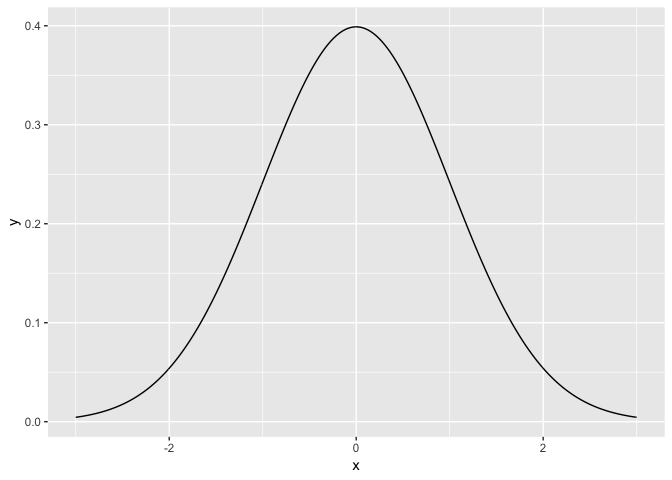
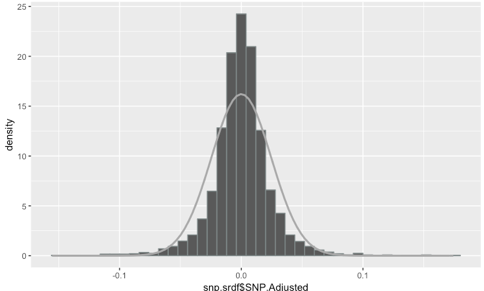
I have a time series of daily returns on S&P 500 (sample size 3051). I plotted a histogram of daily returns and plotted a normal distribution using parameters (sigma and mean) of my sample to visualise "goodness of fit". To do that I run the following code:
From the plot it is visible that a gaussian distribution is not a proper fit so I use StepAIC.ghyp (snp.srdf$SNP.Adjusted) to find the appropriate distribution. The best fit turns to be a symmetric NIG with certain parameters. I fitted my data into that distribution using fit.NIGuv() and saved the results.
So now I am trying to plot the same histogram from the beginning (histogram of my sample) with a NIG density. I have tried to use the stat_function with dghyp but it doesn't work.
Do you know of any way plotting that distribution using ggplot or is there a function in which I can add the NIG parameters (sigma, mu, lambda, chi) to get a density plot.
Looking at the documentation of ghyp, the fit.NIGuv() function returns an object that can be fed to the dghyp() function, which returns the density of the distribution.