I'm extracting from a large dataset and looking to plot values and totals of some of the resultant data. As every extract is different I have to calculate the totals on the fly and can't quite get it to work.
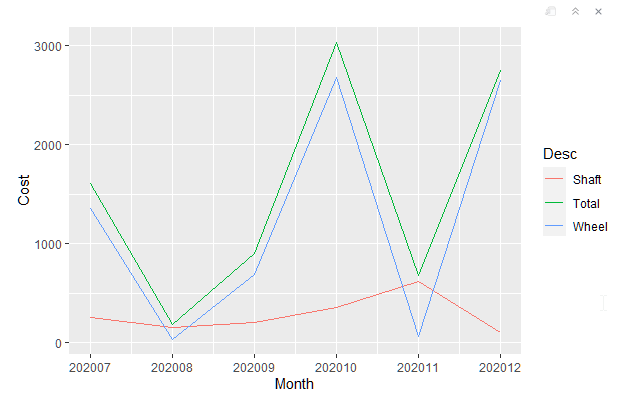
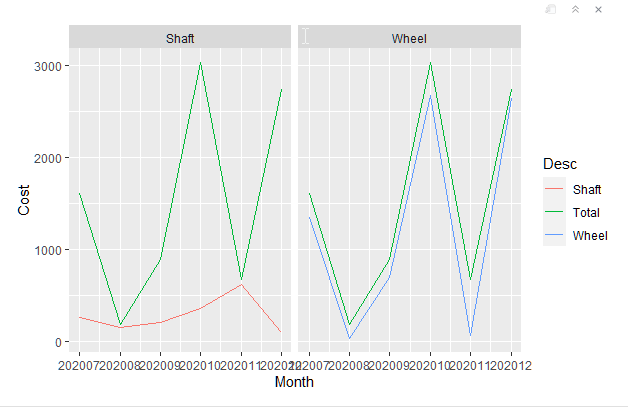
This example displays the monthly cost for Shaft and Wheel and I want to add a third data series for Shaft+Wheel.
I think this should be simple but I just can't find the answer!
Thanks
Michael
library(ggplot2)
# Sample Data Frame
sampdata <-data.frame (Code = c('ab44c', 'ab55d', 'ab44c', 'ab55d', 'ab44c', 'ab55d', 'ab44c', 'ab55d', 'ab44c', 'ab55d', 'ab44c', 'ab55d'),
Desc = c('Shaft', 'Wheel', 'Shaft', 'Wheel', 'Shaft', 'Wheel', 'Shaft', 'Wheel', 'Shaft', 'Wheel', 'Shaft', 'Wheel'),
Month = c(202007, 202007, 202008, 202008, 202009, 202009, 202010, 202010, 202011, 202011, 202012, 202012),
Number = c(5, 45, 3, 23, 4, 89, 7, 2, 12, 88, 2, 47),
Cost = c(256.5, 1352.4, 153.9, 30.05, 205.2, 691.23, 359.1, 2674.75, 615.6, 60.11, 102.6, 2644.69)
)
 # Simple plot.
ggplot(data = sampdata, aes(x = Month, y = Cost, group = Desc)) + geom_line()
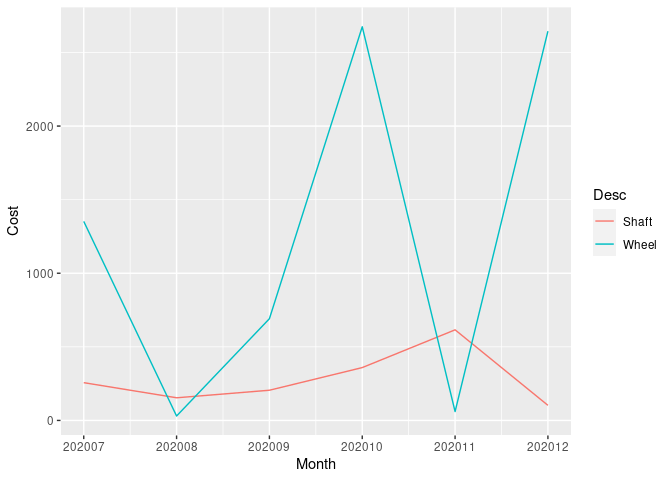
 ) . What I'm looking for is to be able to plot a third line which is the sum of the other two.