Plotting a eCDF and overlay it with standard CDF in R ggplot

Hi,
I need to add theoretical(normal) CDF to eCDF in one plot and later in subgroups.

I followed this:
https://stats.stackexchange.com/questions/153725/plotting-a-ecdf-in-r-and-overlay-cdf
but these code:

 library(ggplot2)
    set.seed(235)
    x<-rgamma(40,2,scale=3)
    p<-qplot(x,stat="ecdf",geom="step")+theme_bw()
    p<-p+stat_function(fun=pgamma,color="blue",args=list(shape=2,scale=3))
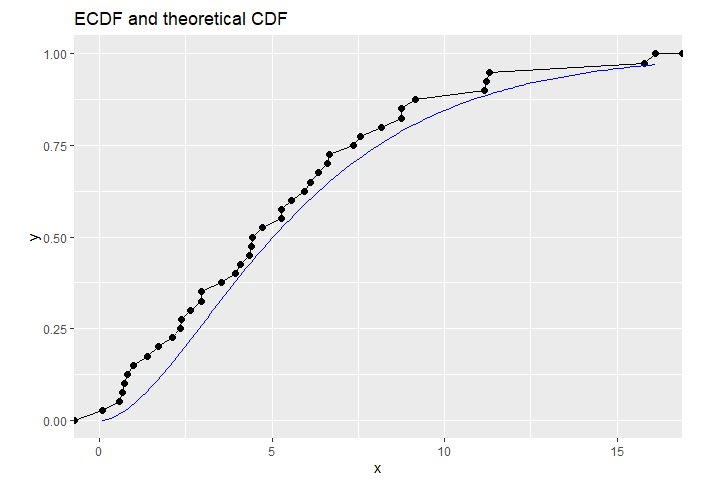
    p<-p+labs(title="ECDF and theoretical CDF")
    p

gives me an error:

Error: Aesthetics must be either length 1 or the same as the data (1): x
Run `rlang::last_error()` to see where the error occurred.

I do not know why ?

Additionally I have read this:
https://stackoverflow.com/questions/24818995/ggplot2-ecdf-faceting-for-subsets-overall-ecdf-in-each-panel?rq=1

ggplot(diamonds) + 
  stat_ecdf(aes(x=carat, colour = color)) + 
  stat_ecdf(data=diamonds[, names(diamonds) != "color"], aes(x=carat), lwd=1, linetype="dotted") + 
  facet_wrap(~color, ncol=4)

and I would like to add normal standard CDF in each panel (apart from those two drawn already).

How do I do this ? Any ideas will be greatly appreciated.
My ideal results will be like here:

https://bjlkeng.github.io/posts/the-empirical-distribution-function/

when every distribution has got nice eCDF, normal CDF (dotted red line) and confidence bands, as well.
But this is not done in R.

I am really not sure what you are doing but will this help?

library(ggplot2)
set.seed(235)
y <- rgamma(40, 2, scale = 3)
x <-   1:length(x)

dat1 <-   data.frame(x, y)
 p <-   ggplot(dat1, aes(y, x)) +geom_step()

p <-  p + stat_function(fun = pgamma,
                    color = "blue",
                    args = list(shape = 2, scale = 3))
p <- p + labs(title = "ECDF and theoretical CDF")
p

I think your first problem is that your x is a vector and ggplot requires a data.frame. I then used ggplot() rather than qplot() as qplot() is pretty archaic and I think better in ggplot().

Hello @Andrzej ,

I prepared an answer to your question, only to see that John (@jrkrideau) beat me to it.
So now just to show an alternative:

After consulting the following 'literature' :

I extracted the following code that displays the empirical and theoretical distribution in one plot:

library(ggplot2)
set.seed(235)
x<-rgamma(40,2,scale=3)
data= data.frame(x=x,cyl=rep("x",40),stringsAsFactors = F)

# p<-qplot(x,stat="ecdf",geom="step")+theme_bw()
p <- ggplot(data,aes(x)) +
       geom_line(stat = "ecdf")+
       geom_point(stat="ecdf",size=2) +
       stat_function(fun=pgamma,color="blue",args=list(shape=2,scale=3)) +
       labs(title="ECDF and theoretical CDF")
p

1 Like

Yes , that vas very helpful, thank you and @jrkrideau thank you too.
I am trying to learn that eCDF as an alternative to histogram with density curve exploring data and to check
the data from departure from eg. normal distribution and other distributions.
Thanks again.

This topic was automatically closed 21 days after the last reply. New replies are no longer allowed.

If you have a query related to it or one of the replies, start a new topic and refer back with a link.