Repex:
#library(ggplot2)
library(tidyverse)
library(shiny)
# Define UI
ui <- fluidPage(
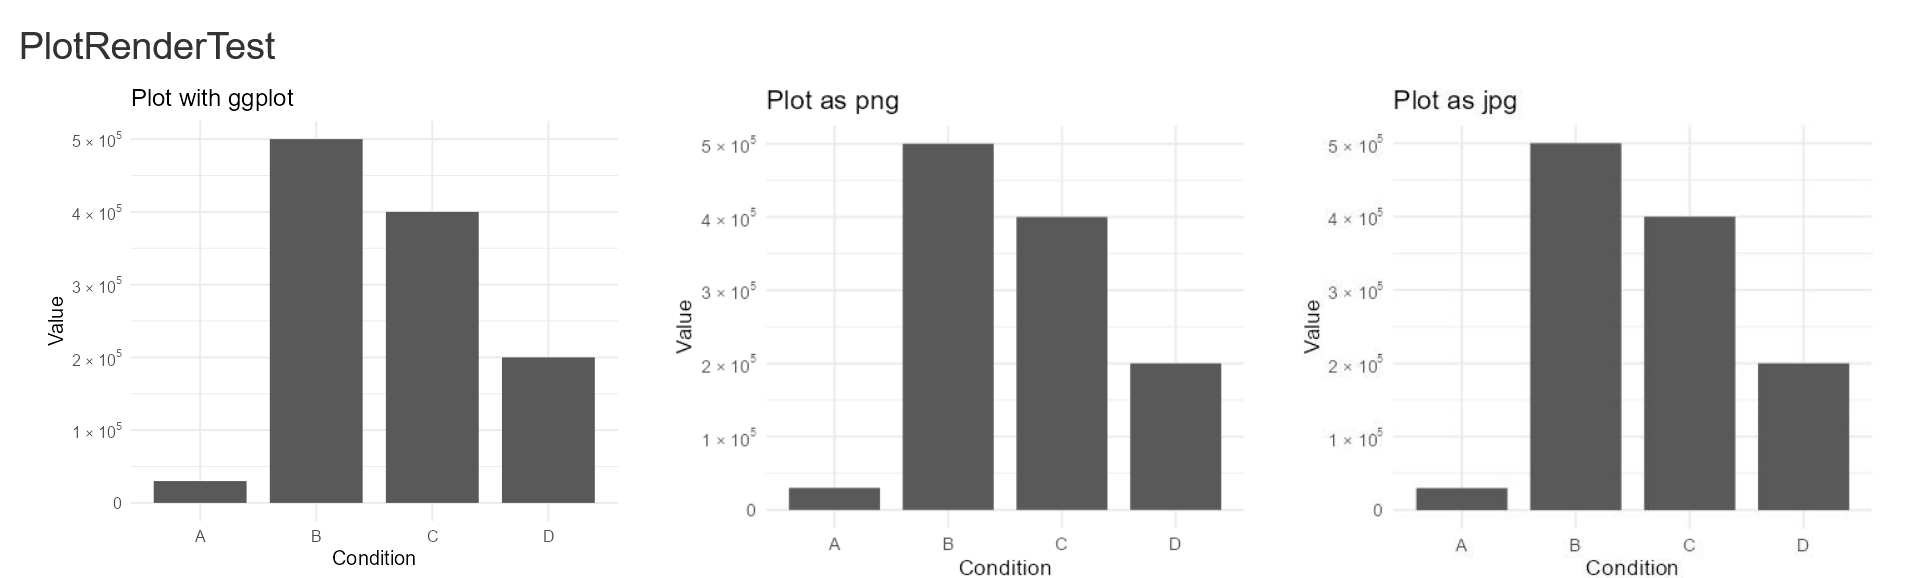
titlePanel("PlotRenderTest"),
column(width = 4, plotOutput("Plot_ggplot")),
column(width = 4, imageOutput("Plot_png") ),
column(width = 4, imageOutput("Plot_jpg") )
)
# Define server logic
server <- function(input, output) {
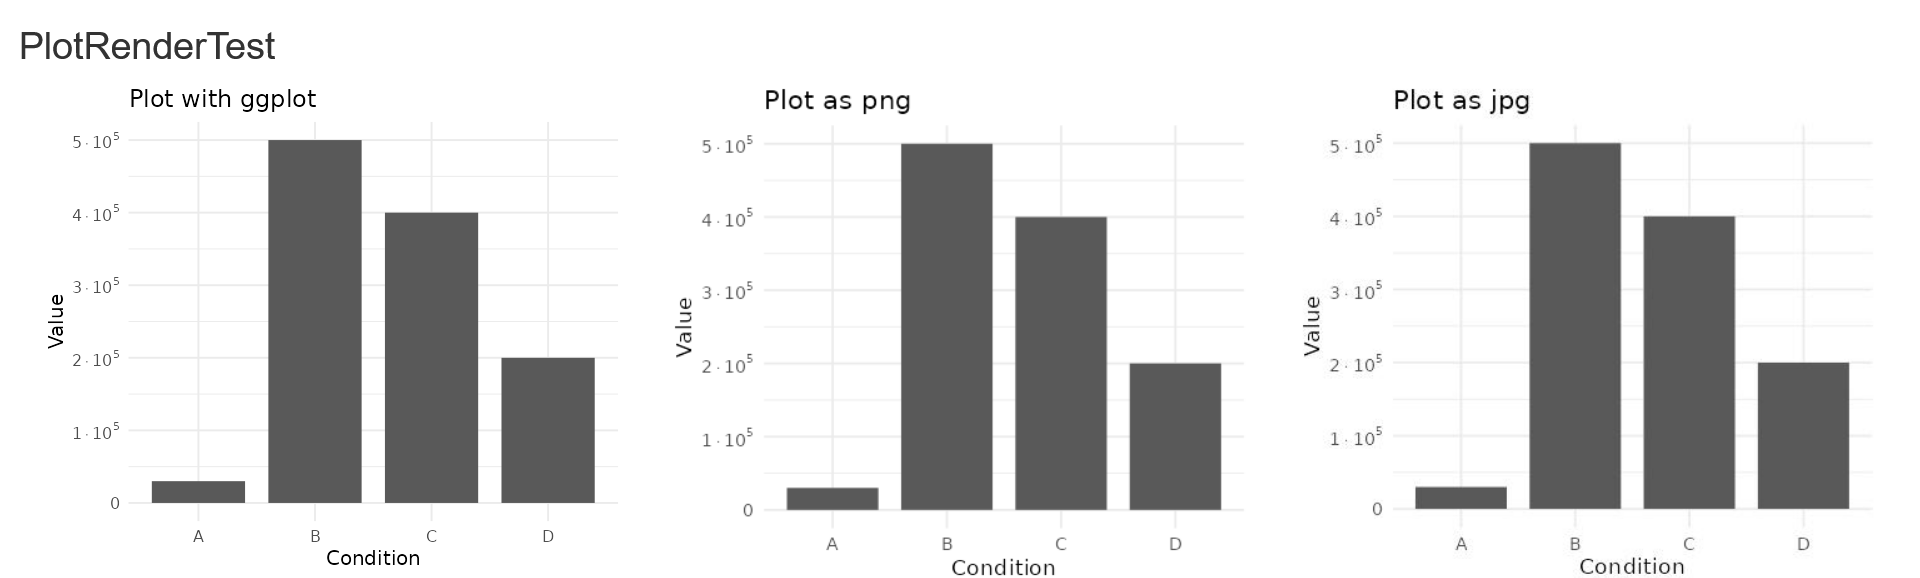
# Function for exp. numbers on Y-Axis
nice_scientific <- function(l) {
# turn in to character string in scientific notation
l <- format(l, scientific = TRUE)
l <- gsub("0e\\+00","0",l)
# quote the part before the exponent to keep all the digits
l <- gsub("^(.*)e", "'\\1'e", l)
# turn the 'e+' into plotmath format
l <- gsub("e\\+","e",l)
l <- gsub("e", "%*%10^", l)
# return this as an expression
parse(text=l)
}
# Data
PlotData = data.frame(Condition = c("A","B","C","D"),
Value = c(30000,500000,400000,200000))
# Base Plot
Plot = reactive({
ggplot(PlotData, aes(x = Condition, y = Value)) +
geom_col(width = 0.8) +
theme_minimal(base_size = 16) +
scale_y_continuous(labels = nice_scientific)
})
# PlotOutput
output$Plot_ggplot = renderPlot({
Plot() + labs(title = "Plot with ggplot") })
# save plot as png
output$Plot_png = renderImage({
ggsave("Plot.png",
plot = Plot() + labs(title = "Plot as png"),
bg = "white", dpi = 80, width=15, height = 13, units = "cm")
# Return the filename for the download function
list(src = "Plot.png", contentType = 'image/png')
}, deleteFile = FALSE)
# save plot as jpg
output$Plot_jpg = renderImage({
ggsave("Plot.jpg",
plot = Plot() + labs(title = "Plot as jpg"),
bg = "white", dpi = 80, width=15, height = 13, units = "cm")
# Return the filename for the download function
list(src = "Plot.jpg", contentType = 'image/jpg')
}, deleteFile = FALSE)
}
# Run the application
shinyApp(ui = ui, server = server)
sessionInfo()
R version 4.3.0 (2023-04-21 ucrt)
Platform: x86_64-w64-mingw32/x64 (64-bit)
Running under: Windows 11 x64 (build 22621)

Matrix products: default


locale:
[1] LC_COLLATE=German_Germany.utf8  LC_CTYPE=German_Germany.utf8    LC_MONETARY=German_Germany.utf8 LC_NUMERIC=C
[5] LC_TIME=German_Germany.utf8

time zone: Europe/Berlin
tzcode source: internal

attached base packages:
[1] stats     graphics  grDevices utils     datasets  methods   base

other attached packages:
 [1] lubridate_1.9.2 forcats_1.0.0   stringr_1.5.0   dplyr_1.1.2     purrr_1.0.1     readr_2.1.4     tidyr_1.3.0     tibble_3.2.1
 [9] ggplot2_3.4.2   tidyverse_2.0.0 shiny_1.7.4

loaded via a namespace (and not attached):
 [1] writexl_1.4.2       tidyselect_1.2.0    vipor_0.4.5         farver_2.1.1        fastmap_1.1.1       tweenr_2.0.2
 [7] promises_1.2.0.1    shinyjs_2.1.0       digest_0.6.31       timechange_0.2.0    mime_0.12           lifecycle_1.0.3
[13] ellipsis_0.3.2      magrittr_2.0.3      compiler_4.3.0      sass_0.4.6          rlang_1.1.1         tools_4.3.0
[19] igraph_1.4.3        utf8_1.2.3          yaml_2.3.7          knitr_1.43          labeling_0.4.2      rARPACK_0.11-0
[25] plyr_1.8.8          mapproj_1.2.11      RColorBrewer_1.1-3  BiocParallel_1.34.2 withr_2.5.0         grid_4.3.0
[31] polyclip_1.10-4     fansi_1.0.4         xtable_1.8-4        colorspace_2.1-0    extrafontdb_1.0     scales_1.2.1
[37] MASS_7.3-60         pals_1.7            dichromat_2.0-0.1   cli_3.6.1           ellipse_0.4.5       rmarkdown_2.22
[43] ragg_1.2.5          generics_0.1.3      rstudioapi_0.14     RSpectra_0.16-1     tzdb_0.4.0          reshape2_1.4.4
[49] readxl_1.4.2        cachem_1.0.8        ggbeeswarm_0.7.2    ggforce_0.4.1       maps_3.4.1          parallel_4.3.0
[55] cellranger_1.1.0    matrixStats_1.0.0   vctrs_0.6.2         Matrix_1.5-4        jsonlite_1.8.5      hms_1.1.3
[61] ggrepel_0.9.3       beeswarm_0.4.0      systemfonts_1.0.4   jquerylib_0.1.4     glue_1.6.2          codetools_0.2-19
[67] mixOmics_6.24.0     cowplot_1.1.1       stringi_1.7.12      gtable_0.3.3        later_1.3.1         extrafont_0.19
[73] munsell_0.5.0       pillar_1.9.0        htmltools_0.5.5     R6_2.5.1            textshaping_0.3.6   evaluate_0.21
[79] lattice_0.21-8      memoise_2.0.1       bslib_0.5.0         corpcor_1.6.10      httpuv_1.6.9        Rcpp_1.0.10
[85] gridExtra_2.3       Rttf2pt1_1.3.12     xfun_0.39           pkgconfig_2.0.3