Can someone help me out here, I have tried troubleshooting with an experienced user, but we both can't figure it out. I'm a newbie to R so I'm lost.
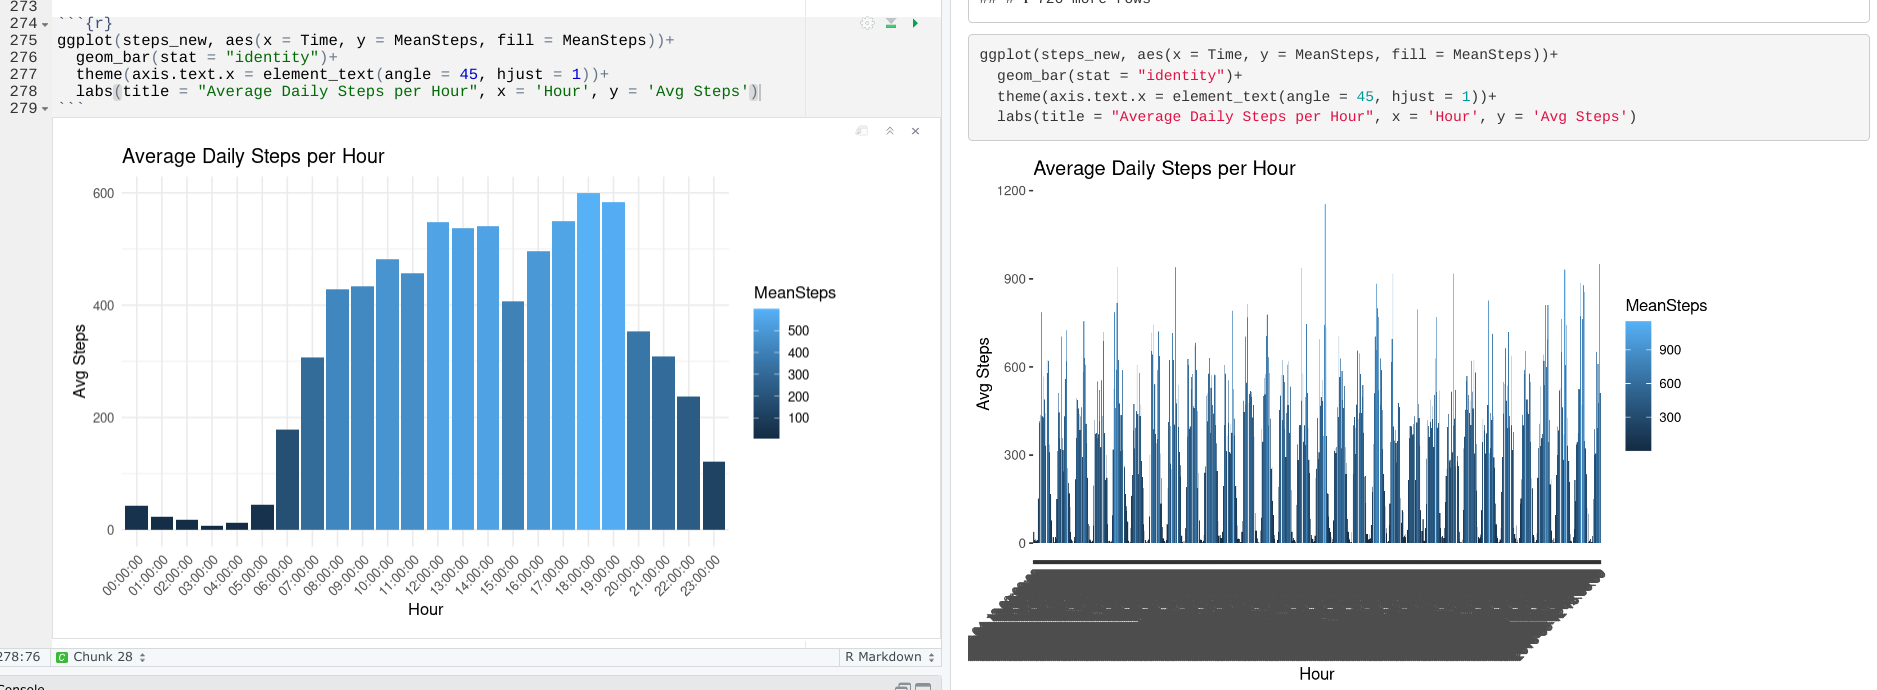
My plot isn't showing up correctly when I knit it, but it shows up correctly in the script. Exact same code, but values are somehow getting changed and the chart obviously isn't rendering correctly.
The most typical reason I see for this is that the data object used interactively, steps_new, has undergone some additional processing or data cleaning that doesn't actually occur when the RMarkdown/Quarto document is executed linearly.
Can you go through these steps:
Clear your environment, or at least the steps_new object and any objects named Time or MeanSteps. Use rm(list = ls()) to clear everything quickly.
Run all of the data processing steps from the beginning of the file manually.
One of my first steps in troubleshooting is to clear everything with "Session > restart R" or shift+command+0. Never rely on anything that exists in the global environment. It looks like you're filtering the dataframe to span only a single day, and that filter is not in the markdown.
Good point on the global environment, and something to note about RMarkdown/Quarto documents is that they execute their code in an entirely new environment when knitting/rendering i.e. any objects available in your interactive environment are not accessible when knitting/rendering a .rmd/.qmd doc.