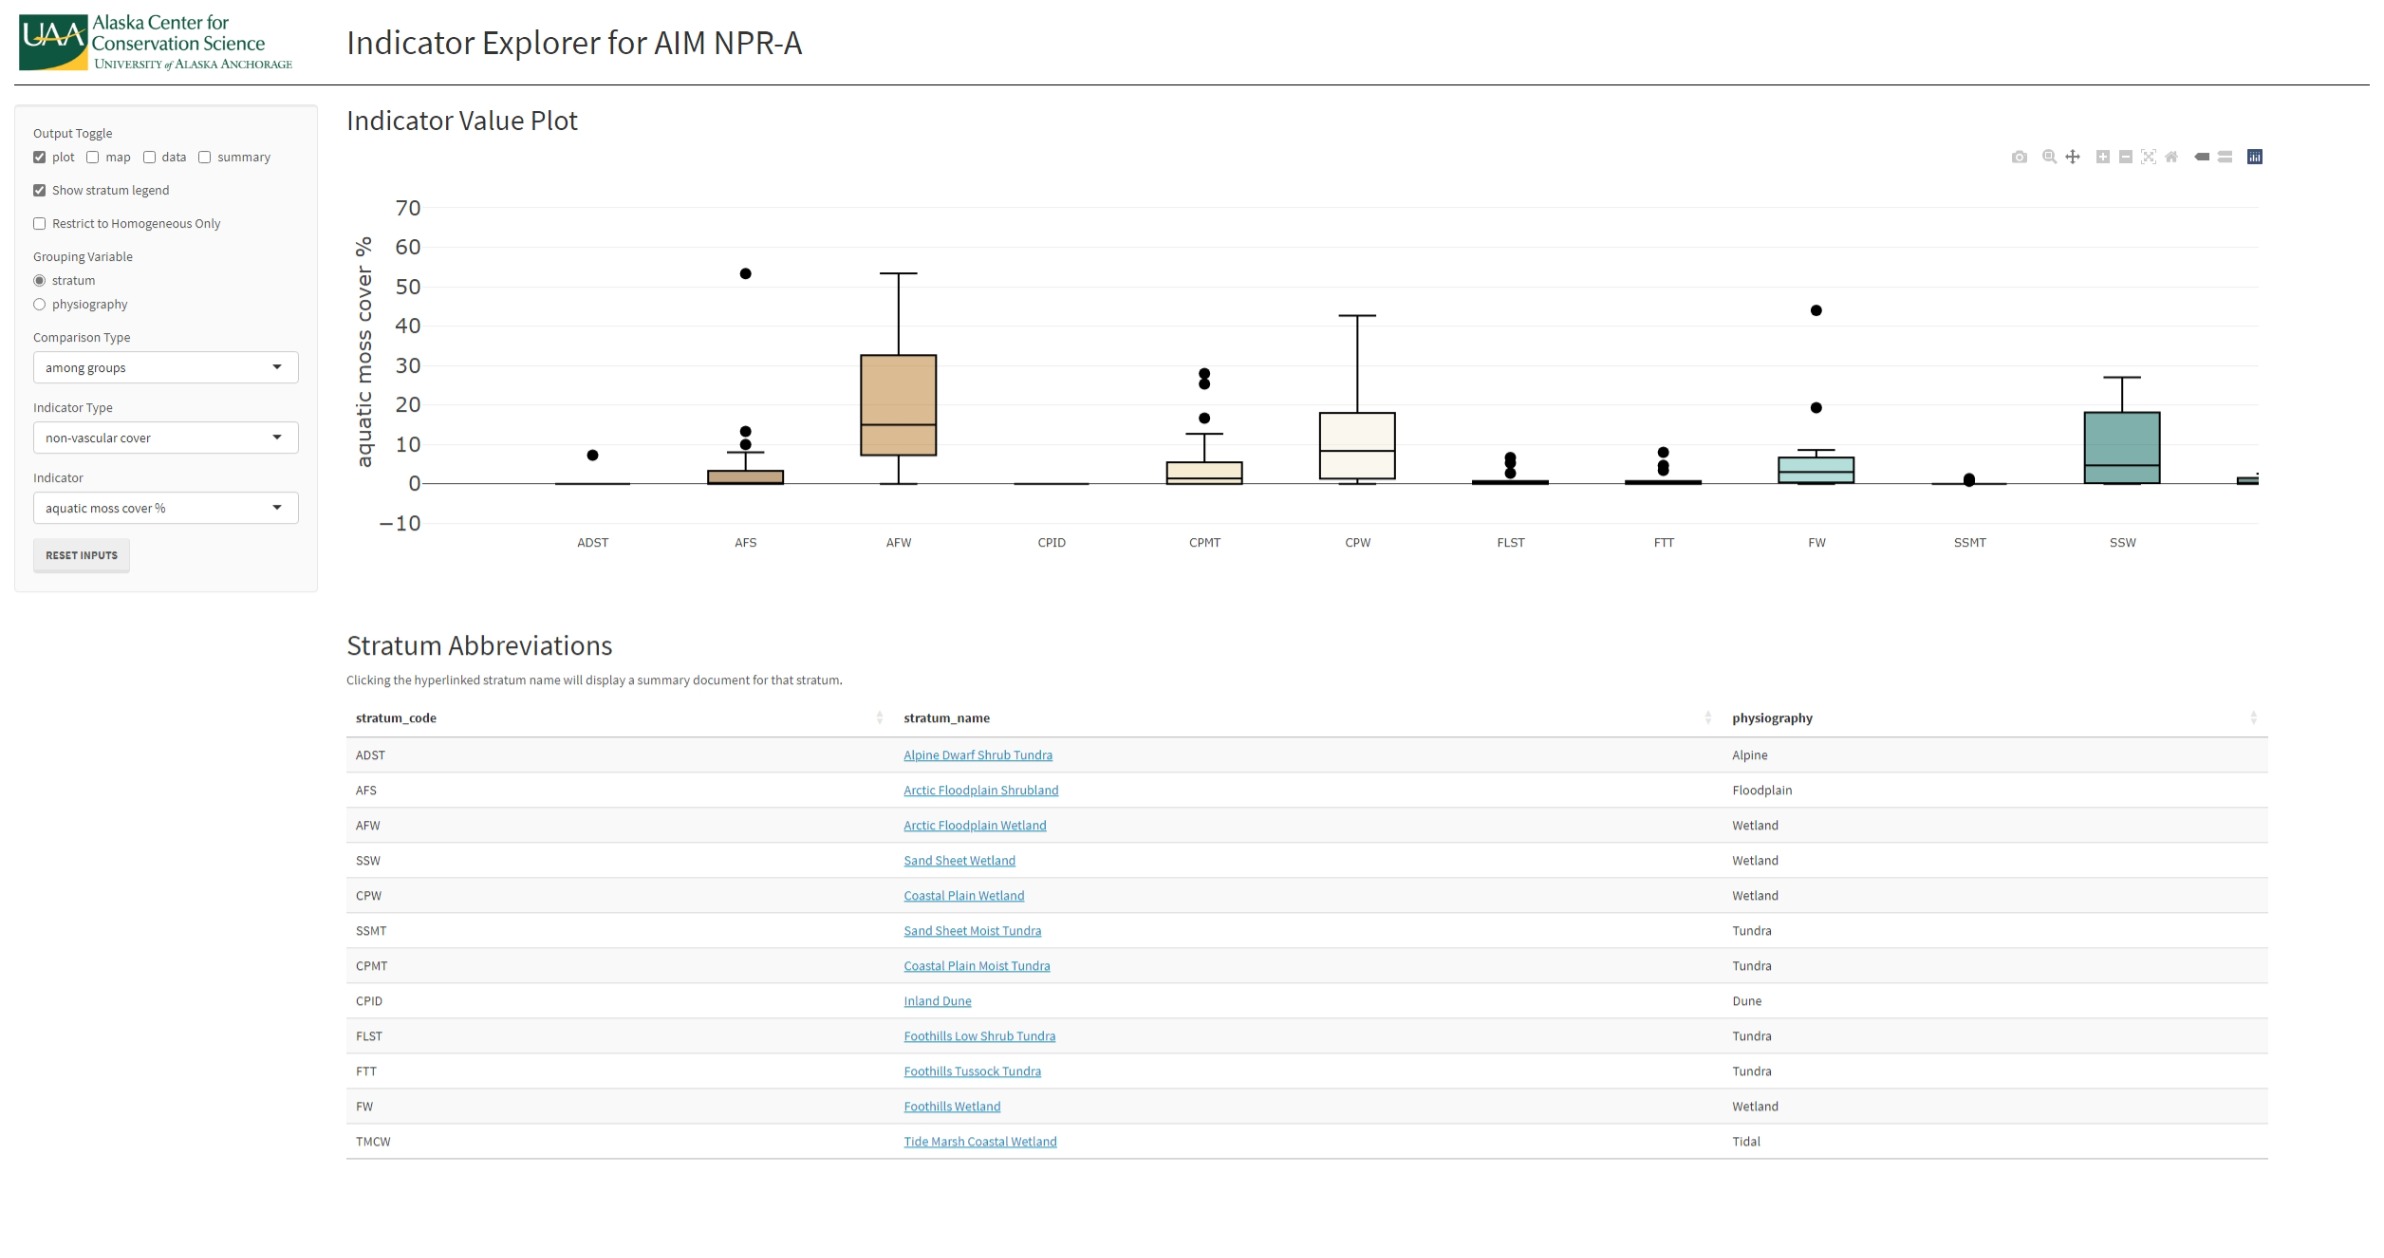
I stumbled across an app that served up plots of environmental data. It appears to be built using plotly. When you hover in the upper right of the plot several interactive options come up. Does anyone know of similar functionality using R or ggplot ?
Hi @clarktar. You can check out the ggplotly() function from the plotly package.
library(tidyverse)
library(plotly)
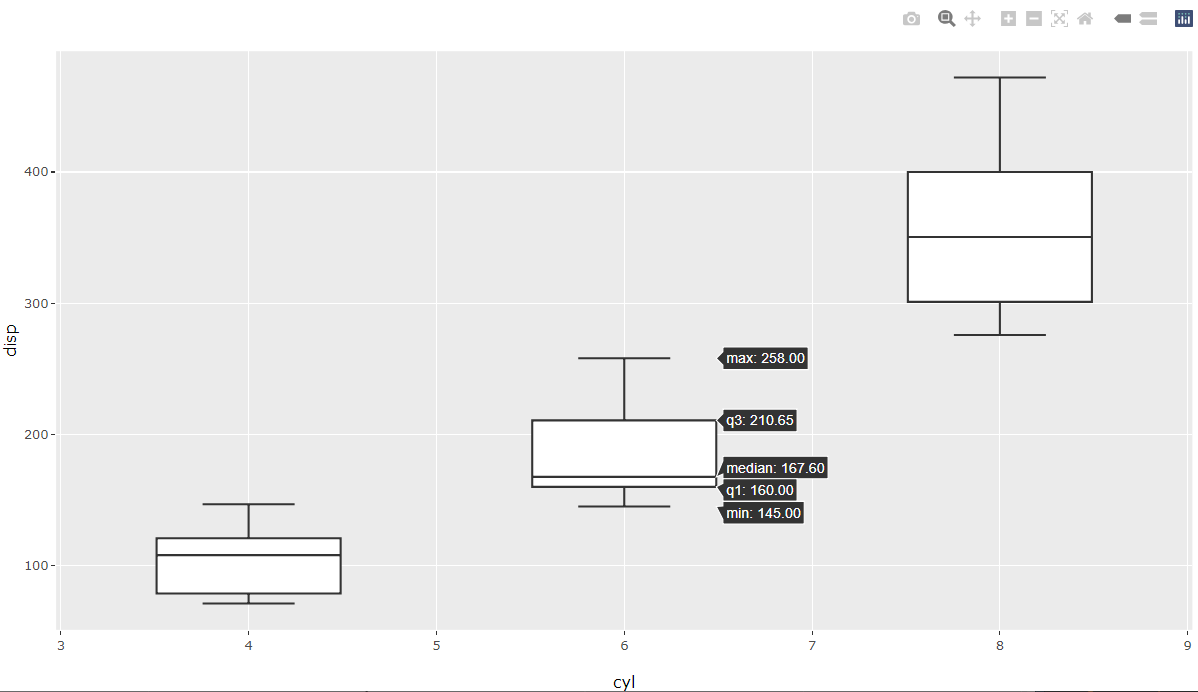
g = ggplot(mtcars, aes(x = cyl, y = disp)) +
geom_boxplot(aes(group = cyl))
ggplotly(g)
1 Like
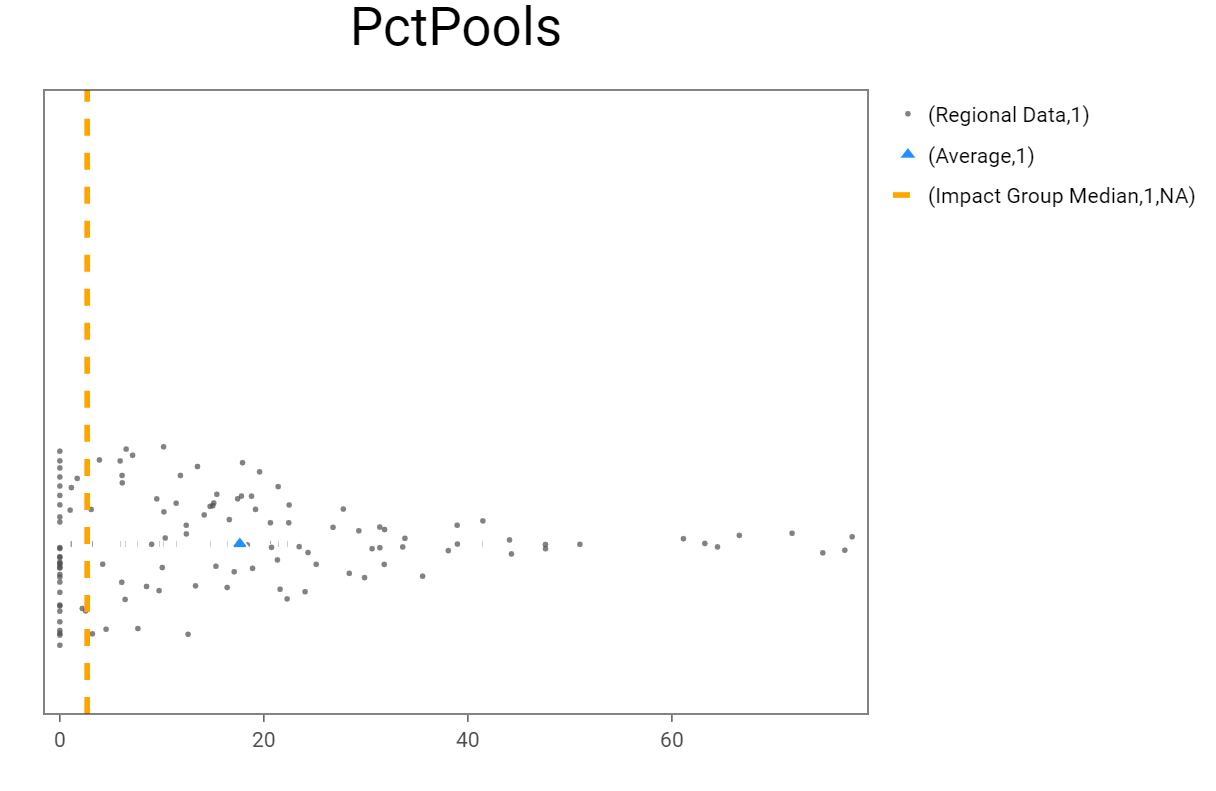
Thanks! Looks like there is alot of nuance to using ggplotly. I simply tried to pass it the plot in this post and several elements end up not being drawn or drawn "incorrectly".
How to add geom_vline to Legend - tidyverse - Posit Community (rstudio.com)
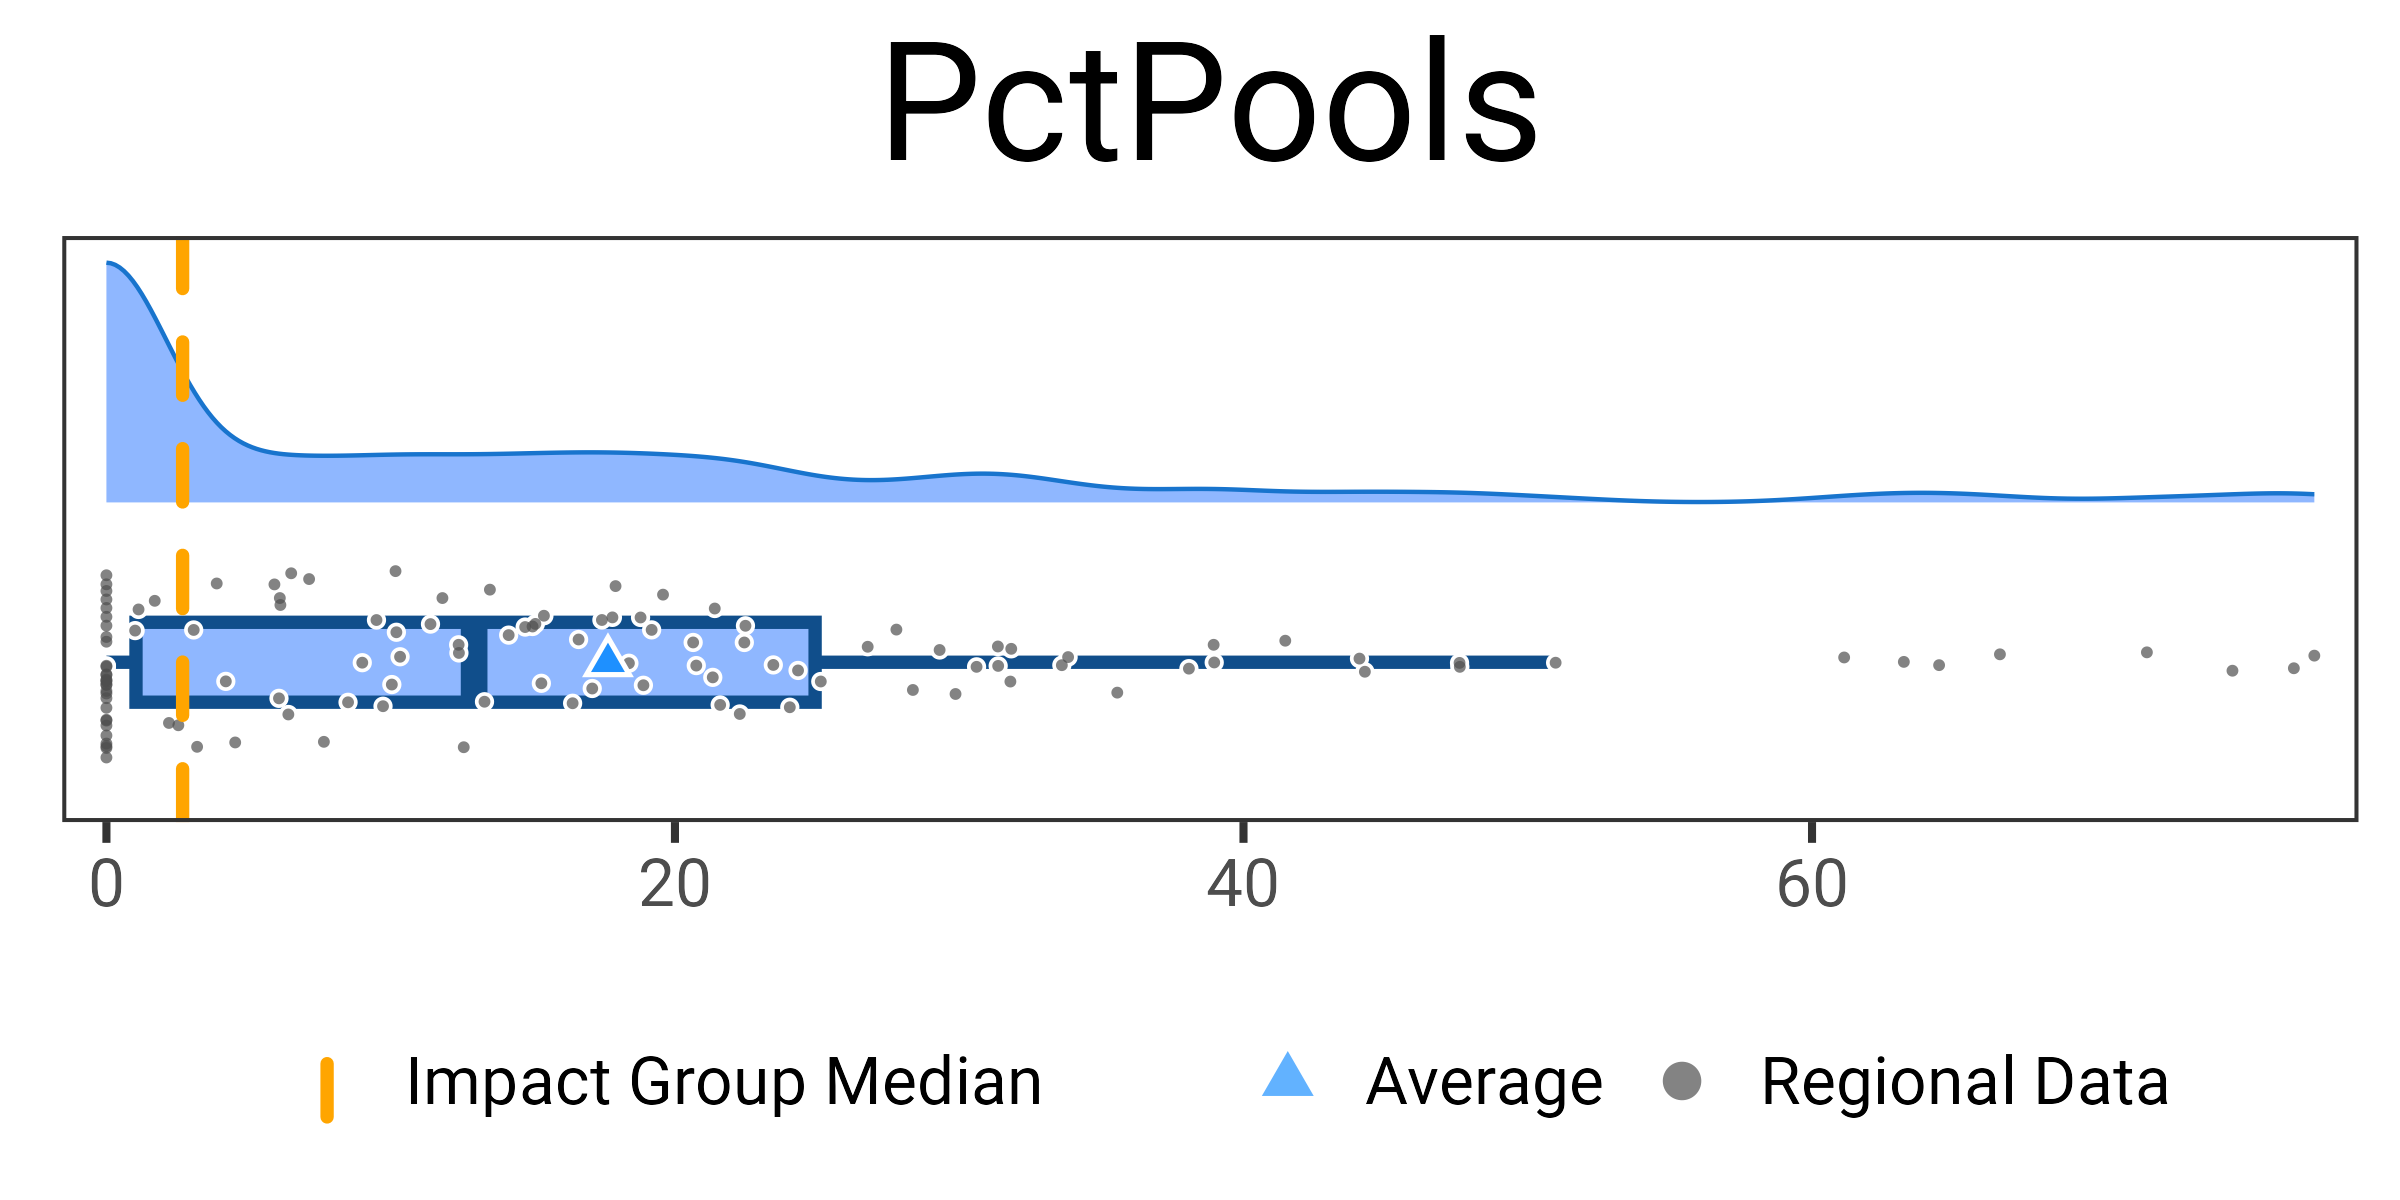
Here is what is looks like before and after adding ggplotly:
This topic was automatically closed 42 days after the last reply. New replies are no longer allowed.
If you have a query related to it or one of the replies, start a new topic and refer back with a link.