Hi, I am trying to use custom colours with a dataset in Plotly. The named vector works from a line graph and other graphs, but doesn't for the stacked area graph. Any ideas?
library(plotly)
library(tidyverse)
library(palmerpenguins) # for the dataset
penguins_cols <- c("Adelie" = "blue",
"Gentoo" = "red",
"Chinstrap" = "green")
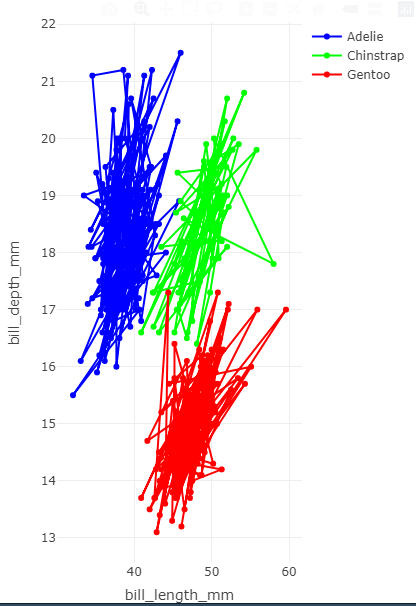
# works for line graphs
plot_ly(penguins,
colors = penguins_cols) %>%
add_trace(x = ~bill_length_mm,
y = ~bill_depth_mm,
color = ~species,
type = "scatter",
mode = "lines+markers")
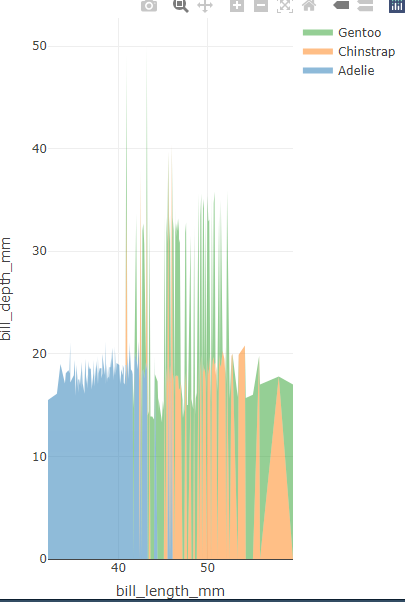
# doesn't work for area graphs
plot_ly(penguins,
colors = penguins_cols) %>%
add_trace(x = ~bill_length_mm,
y = ~bill_depth_mm,
fillcolor = ~species,
mode = "none",
stackgroup = 'one')