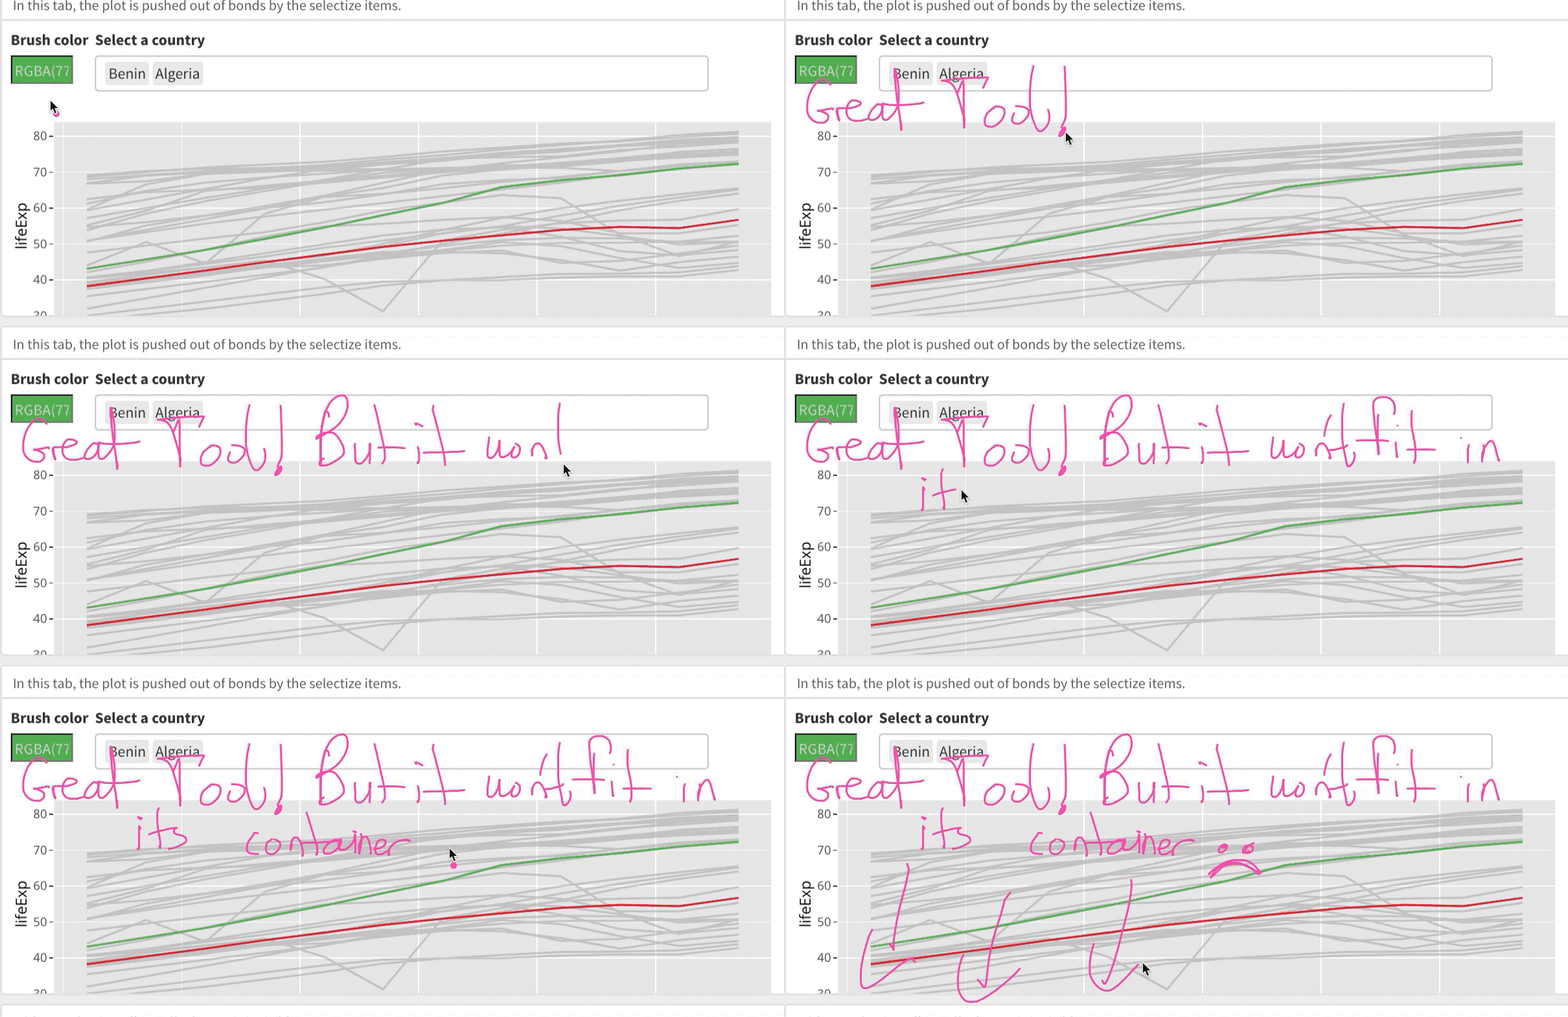
I am having trouble getting my plotly plot to fit in its flexdashboard container. The bottom gets cut off.
Consider the following reprex:
    ---
    title: "Plotly Flexdashboard Conflict"
    output:
      flexdashboard::flex_dashboard:
          source_code: embed

    ---

    Column
    ---

    ### In this tab, the plot is pushed out of bonds by the selectize items.

    ```{r}
    library(tidyverse)
    library(plotly)
    library(gapminder)
    library(flexdashboard)

    gapminder_highlighted <-
      highlight_key(gapminder[1:408,], ~country, "Select a country")

    gapminder_ggplot <-
      gapminder_highlighted %>%
      ggplot(aes(x = year, y = lifeExp, group = country), alpha = 0.2) +
      geom_line()

    gapminder_plotly <- ggplotly(gapminder_ggplot)

    highlight(gapminder_plotly, dynamic = T, selectize = T, persistent = T)

    ```

    ### Without selectize, all is well. The x axis is visible.

    ```{r}
    gapminder_plotly
    ```

    Column
    ---

    ### When plots overflow, flexdashboard is meant to add a scrollbar. E.g.

    ```{r}
    plot(cars)
    plot(nhtemp)
    plot(cars)
    plot(nhtemp)
    ```

    ### Although this does not actually work for all elements. E.g. Text generated from code chunks fails to trigger slider     addition:

    ```{r}
    cat( rep("Flex is not responsive to text overflow here.           ", 100) )
    print("This line is hidden")
    ```
Output is on Rpubs here so you can have a look: RPubs - Plotly Flexdashboard Conflict
The first gapminder plot is pushed out of bounds by the selectize items. And flexdashboard doesn't trigger the addition of a vertical scrollbar like it should.