Hello,
I am using an Rmarkdown file to create a dashboard using Flexdashboard.
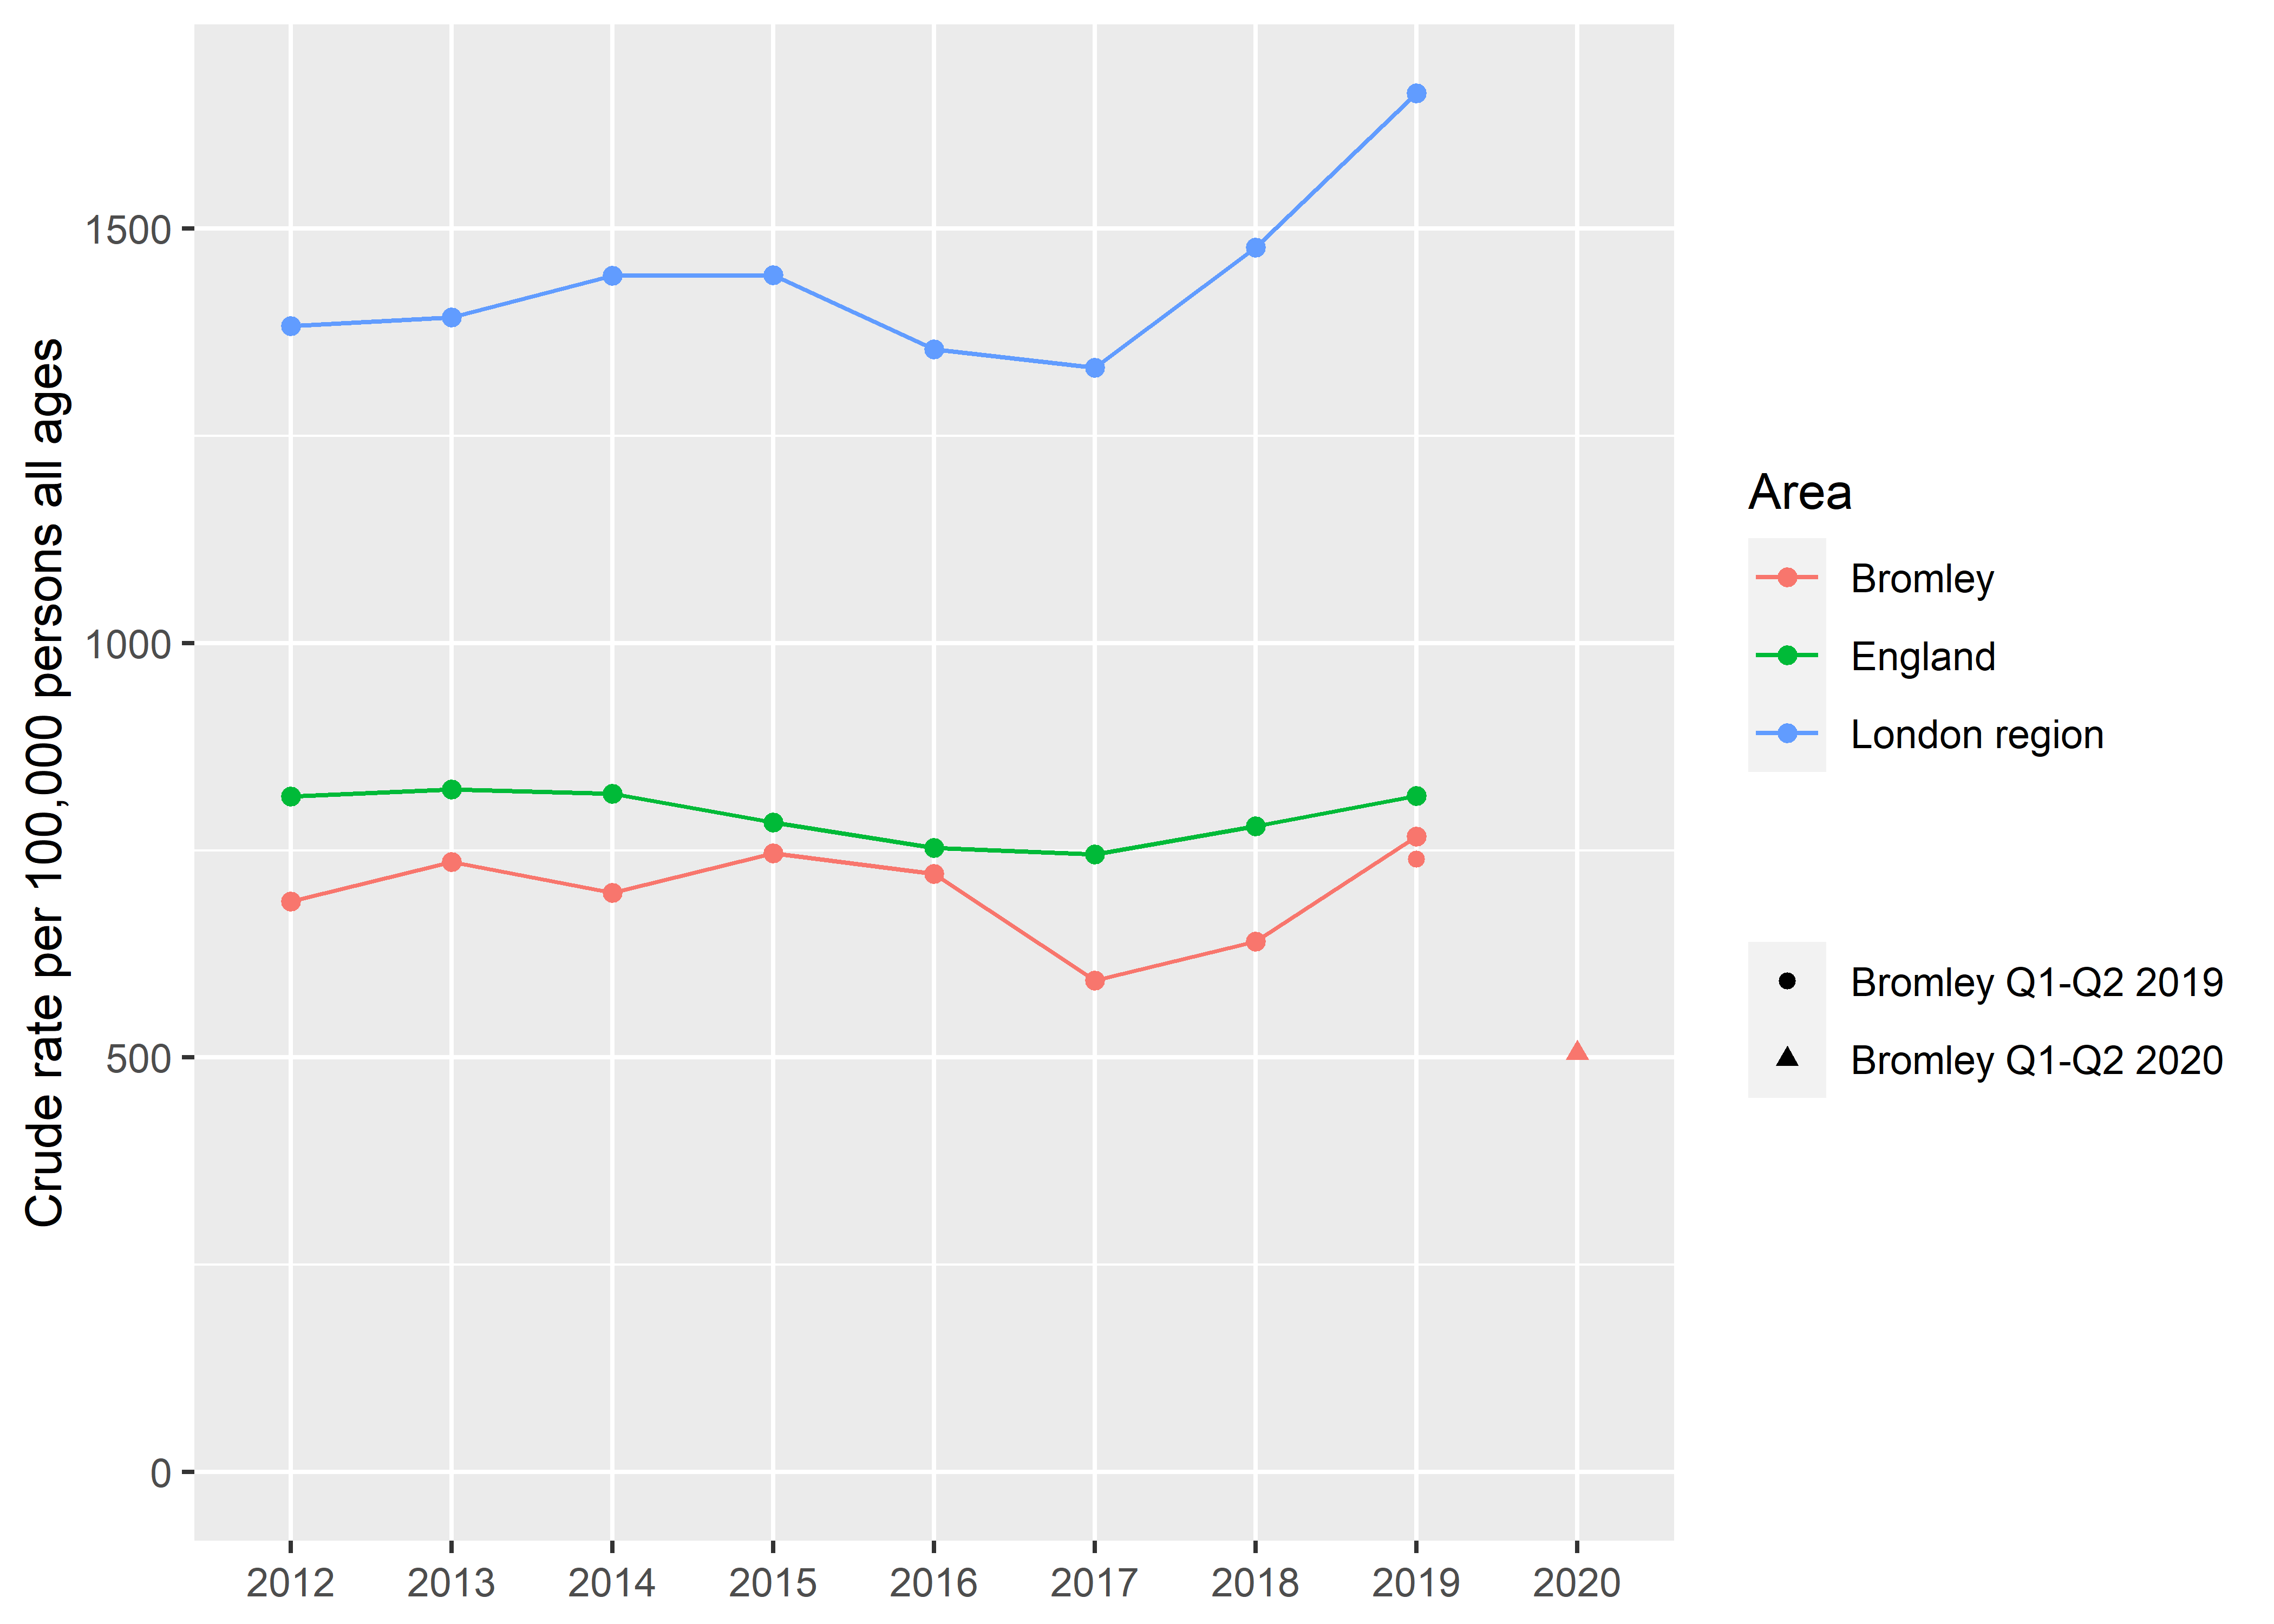
Using ggplot only my legend is correct. The following code creates the chart:
p <- ggplot(data = df, aes(x=Timeperiod, y=Value, group = AreaName, colour = AreaName, text = paste("Area name: ", AreaName, "
Time period: ", Timeperiod, "
Rate: ", round(Value,1), "per 100,000"))) +
geom_line() +
geom_point() +
geom_point(data = sti_Q, aes(shape = c(paste(AreaName, qtr, Timeperiod)))) +
theme(axis.text.x = element_text(vjust = 0.5), axis.title.x = element_blank()) +
labs(y = "Crude rate per 100,000 persons all ages", colour = "Area", shape = "") +
guides(shape = guide_legend(order = 2),colour = guide_legend(order = 1)) +
expand_limits(y=0)
Adding plotly:
p <- ggplot(data = df, aes(x=Timeperiod, y=Value, group = AreaName, colour = AreaName, text = paste("Area name: ", AreaName, "
Time period: ", Timeperiod, "
Rate: ", round(Value,1), "per 100,000"))) +
geom_line() +
geom_point() +
geom_point(data = sti_Q, aes(shape = c(paste(AreaName, qtr, Timeperiod)))) +
theme(axis.text.x = element_text(vjust = 0.5), axis.title.x = element_blank()) +
labs(y = "Crude rate per 100,000 persons all ages", colour = "Area", shape = "") +
guides(shape = guide_legend(order = 2),colour = guide_legend(order = 1)) +
expand_limits(y=0)
ggp <- ggplotly(p, tooltip = "text")
ggp %>% config(displaylogo = FALSE, modeBarButtonsToRemove = list("autoScale2d", "resetScale2d","select2d", "lasso2d", "zoomIn2d", "zoomOut2d", "toggleSpikelines", "zoom2d", "pan2d"))
creates the following. See the legend:
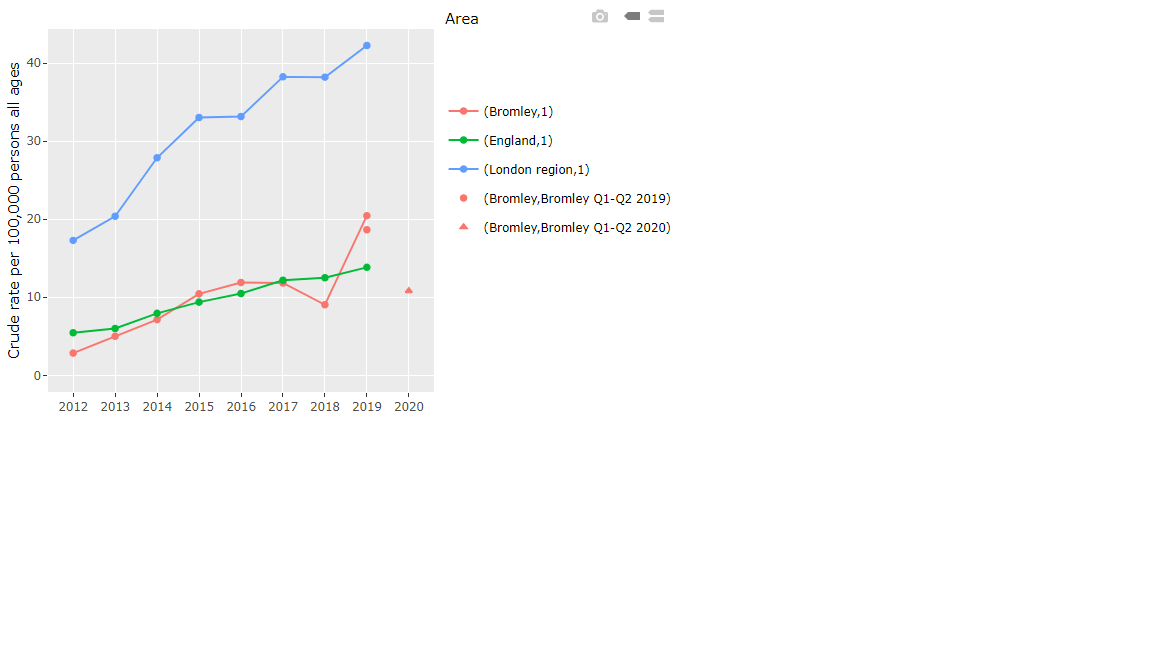
Is the reason for this obvious or is it a problem as I am using plotly in flexdashboard. What might be abetter approach to introducing some interactivity in flexdashboard (i.e. tooltips)
Thanks