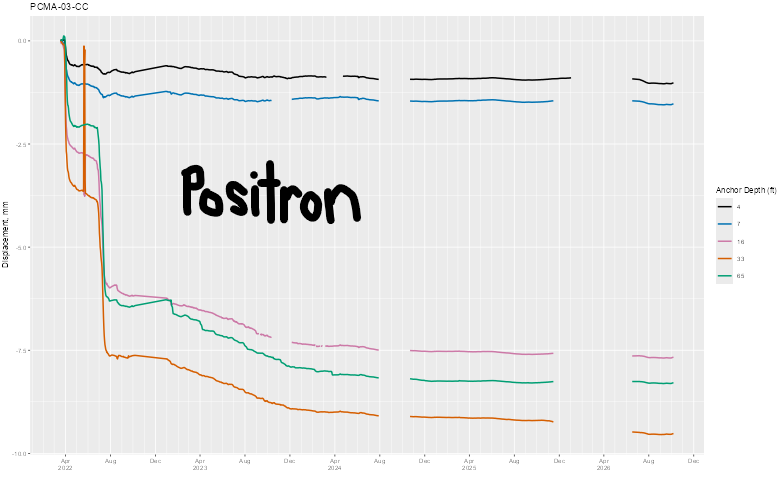
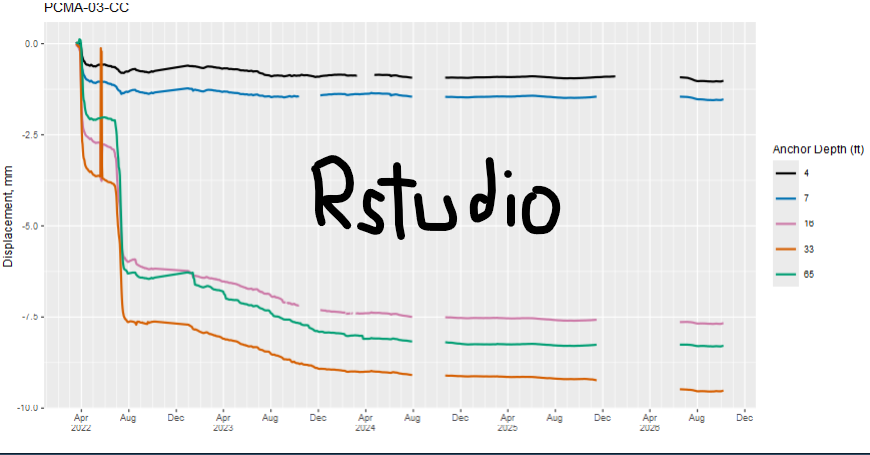
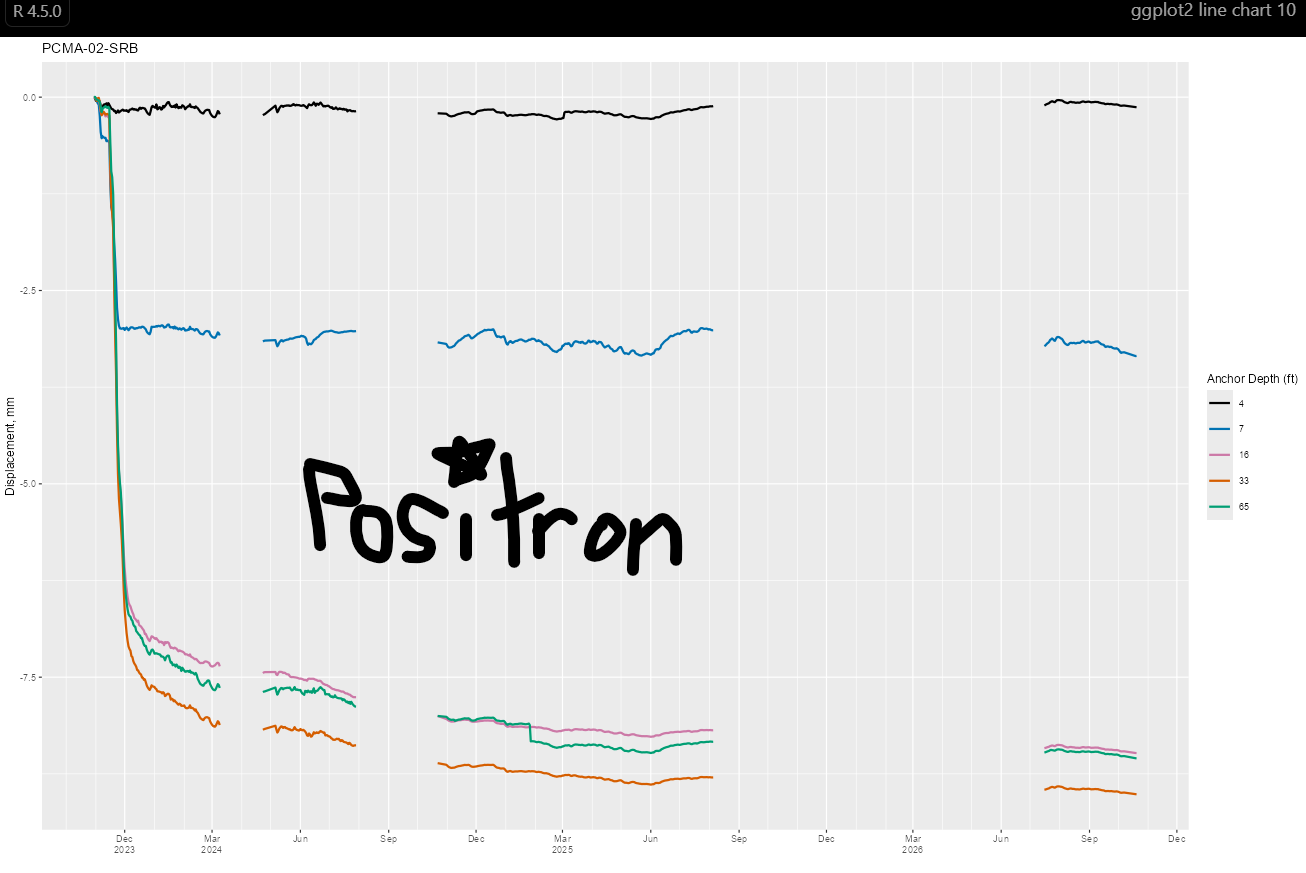
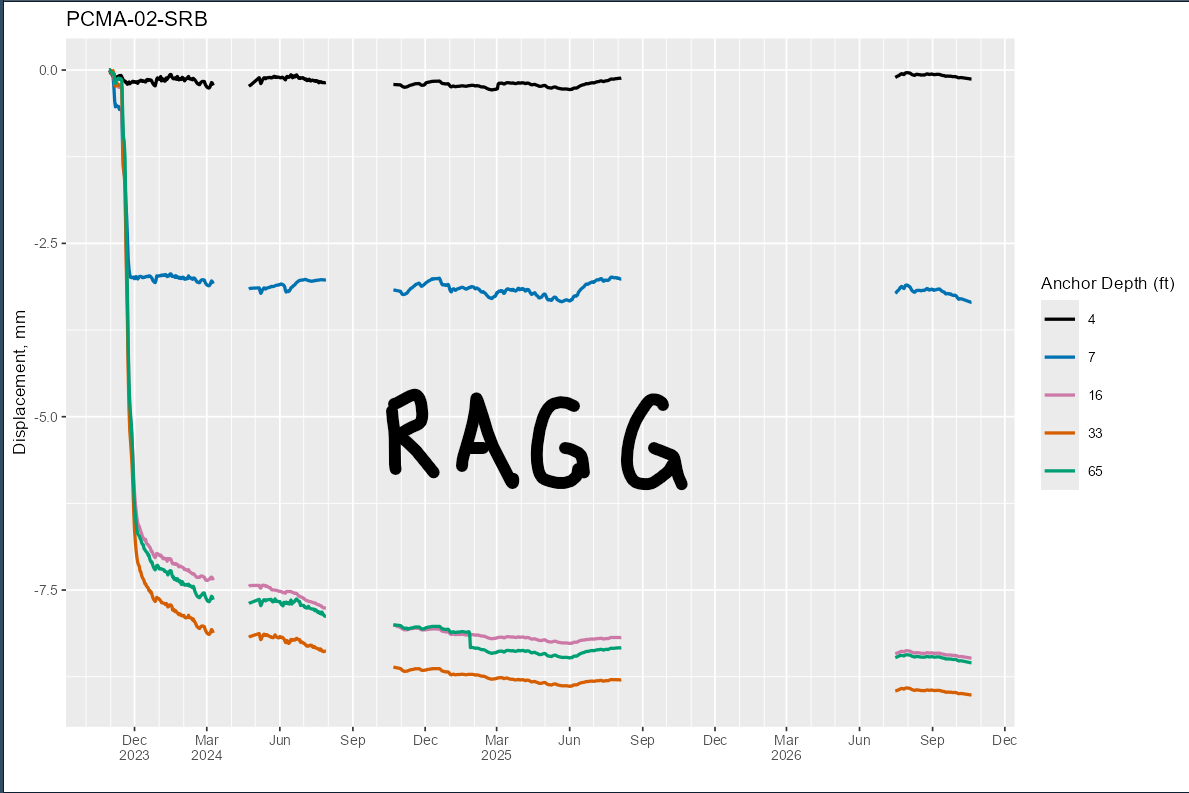
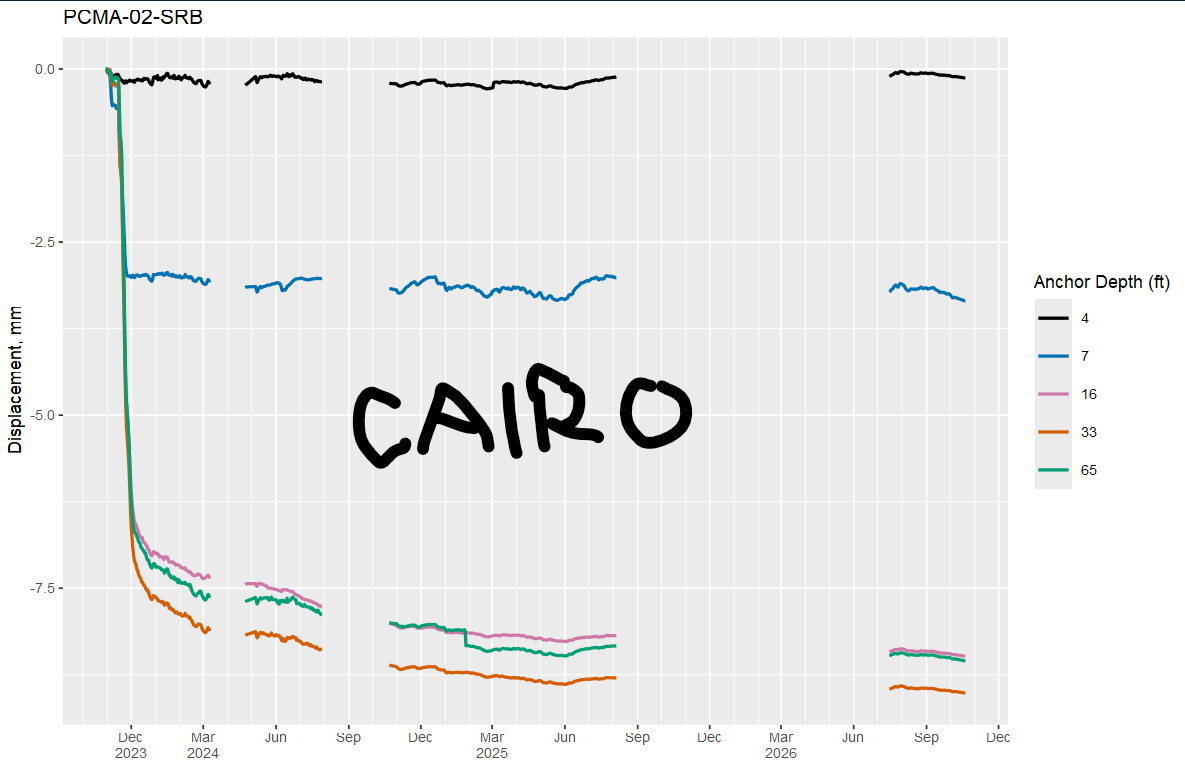
Downloaded Positron today. In my plot window, the plot text is very tiny as compared to what it was in my RStudio window. I'm creating ggplots with R in a Quarto doc. Attached are screenshots from each.
How do I change the settings in Positron so I can read the axis text and labels? In Positron, I've tried adjusting the plot size and shape. A custom size (e.g. 600 x 300) enlarges the text, but it becomes blurry.
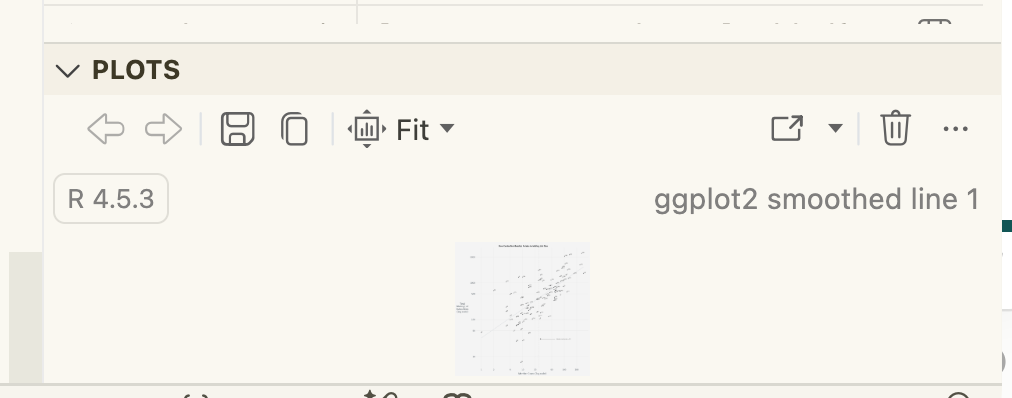
Are you asking about seeing things in your session or when you save them for later? You can resize the plot area or click on the box with an arrow in it (just to the left of the trash can).
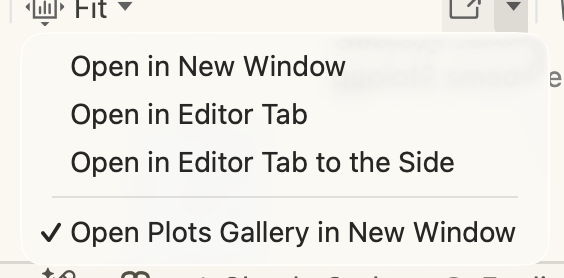
Opening the graph in it's own window lets you size it however you want, save it, etc. I like the choices that show when you click the arrow on the button:
Can you also compare using the ragg backend in RStudio to what you see in Positron, so you are comparing apples to apples? We use a different backend by default than RStudio, so if you can opt in to ragg in RStudio that can help us understand if any differences you are seeing are because of the backend rendering or something on the frontend.
Thanks John! Yes, I'm in a live session doing EDA and updating code. When I resize the plot in the plot window - even making the window as large as the window can get, as well as opening in a new window, the axis text size does not change, and it appears to be about 0.003-point font. When I publish to an .html file, it's all good and sized correctly (as it was in RStudio). So that works, just wondering what I can do to see the text while working on the report.
Thank you! I changed from Cairo to RAGG in RStudio (latest version), and have screenshots below (doesn't appear to be any changes in axis-font size between the two in the Plots window). When I render to .html, RStudio and Positron produces the same output (and it's sized exactly how I want it). Only in the plot window does it make really tiny micro text for all text in the plot.
Thanks for checking that! Since ragg in RStudio looks the same as Cairo there, the graphics backend doesn't seem to be the differentiator. The pattern you describe, where geometry fills the pane but all the text stays tiny no matter how you resize, points more toward a mismatch between the size the R graphics device believes it is and the size the plot is actually rendered at.
We have an open issue that may be exactly what you're hitting: dev.size() broken in latest Positron version · Issue #12138 · posit-dev/positron · GitHub. The underlying problem is that Positron's graphics device reports a fixed default size via dev.size(), and that size is never updated when the plot pane resizes. Since ggplot (and base graphics) size text in absolute units relative to the device dimensions, a device that thinks it is much smaller than the actual rendered plot would produce exactly your symptom, where geometry stretches to fill the pane while all text stays tiny.
A few things that would help us confirm this:
Check dev.size(). After plotting in Positron, run dev.size("in"), then resize the plot pane and run it again. If it returns the same value regardless of the pane size (and differs from what RStudio reports for a similar pane), that would confirm you're seeing the same underlying issue.
A minimal reprex. If you run plot(1:10) in a plain R console (no Quarto, no ggplot2), is the text also tiny? That would tell us whether anything about your Quarto document or ggplot theme is involved.
Your display setup. What OS are you on, and what monitor(s) are you using? In particular, are you on a high-DPI display (like a Retina MacBook screen or a 4K monitor with display scaling)?
Versions. Which Positron build and R version are you on?
Positron: dev.size() returns the same thing (6.667" for both dimensions) regardless of plot pane size and regardless if the pane is on an external monitor or my laptop display! It varies with plot resizing in RStudio.
plot(1:10) dev.size() returns the same values as ggplot() graphics, even when resizing the pane.
I'm using Windows 11 Enterprise 25H2. I have my laptop display (Lenova ThinkPad 2560 x 1600) and two external HP 27H monitors.
Your dev.size() results and your comparison with RStudio helped me find what I think the cause in. Looks like there are two separate problems here.
1. Plot text is smaller in Positron on Windows
R measures text size in points, and one point is 1/72 of an inch. To show a plot on the screen, the IDE must decide how many screen pixels are in one inch. RStudio uses 96 pixels per inch on all platforms. Positron uses 96 pixels per inch on macOS, but it uses 72 pixels per inch on Windows and Linux. I am not sure why TBH!
As a result, 12-point text is 16 pixels high in RStudio and 12 pixels high in Positron on Windows. This applies to all sizes that R measures in points or inches: text, point symbols, and line widths. In Positron on Windows, they are 75% of their size in RStudio. Your monitors and the size of the Plots pane do not change this ratio. We are discussing whether Positron must use 96 pixels per inch on Windows and Linux too.
This also explains why the geometry fills the pane but the text does not grow. In both IDEs, the data area of a plot expands to fill the pane. The text stays at the same number of points. This is how R graphics work, so only the 75% difference is specific to Positron.
Positron records your plot on a hidden graphics device, and then draws it again at the size of the Plots pane. The hidden device does not get the size of the pane. As a result, dev.size() always gives the default size of that device (480 x 480 pixels, which is 6.667 inches at 72 pixels per inch). The plot that you see has the correct size. Only the value from dev.size() is wrong. This bug does not cause the small text but we do still plan to correct it.