Hello everyone,
I really need a good advice on how to plot very large raster data in R (extension:entire World and resolution 1kmx1km).
I use terra to work with rasters but I know that I have to convert them into a dataframe to plot them with ggplot2.
Very often my R software crashes when I try to convert them into a dataframe or plot them thus I would like to find an efficient and good way to plot them preventing R from crashing.
While this may be somewhat different problem from the one you are asking: have you considered plotting with {tidyterra}? It has a very ggplot2 friendly take on rasters plotting...
And more directly to your question: should your raster prove too detailed for your plotting needs you can aggregate it a bit - eg. terra::aggregate(your_raster, fact = 4) will return a raster with resolution one quarter of the origina.
Hi @jlacko thanks for the response.
Because of the fine resolution when I manage to plot it ( when I am lucky and it does not crash) the plot seems empty ( because of the high resolution).
My colleague is able to plot these types of huge data with python nicely..
I would like to find a way to plot them in R to produce nice maps for publications.. I cannot aggregate the raster to a coarser resolution as it won't reflect the true value
Thanks a lot .. tmap works beatifully ...
Anyway I just faced another issue you may be of help..
When I am trying to render to a pdf the code I built using Rmarkdown I face the following error related to the sf object .. error that does not occur if I run the code chunk by chunk.
At line 54 I transform a csv file into an sf object using the function st_as_sf()
I don't mean to pick up fights, but given that the Earth's surface is some 4 * pi * 6371^2 kilometers square and your cell area is 1 × 1 km - your raster most likely outresolves any output device you are about to use for your publication, be it a screen or a printer.
So in order to render it you must be aggregating, the only question is whether it happens under your control or whether you outsource the aggregation to some default setting inside of some package - just for your information in case of {tmap} this is governed by the option max.raster, defaulting to 1e7 (so your raster gets downsampled by a factor of roughly 50). See ?tmap::tmap_options for more info on this.
Thanks for your advice ... you are probably right ..
My rasters contain NA, should I include the option na.rm=TRUE when computing the aggregation?
I guess that the default fun is "mean" ..
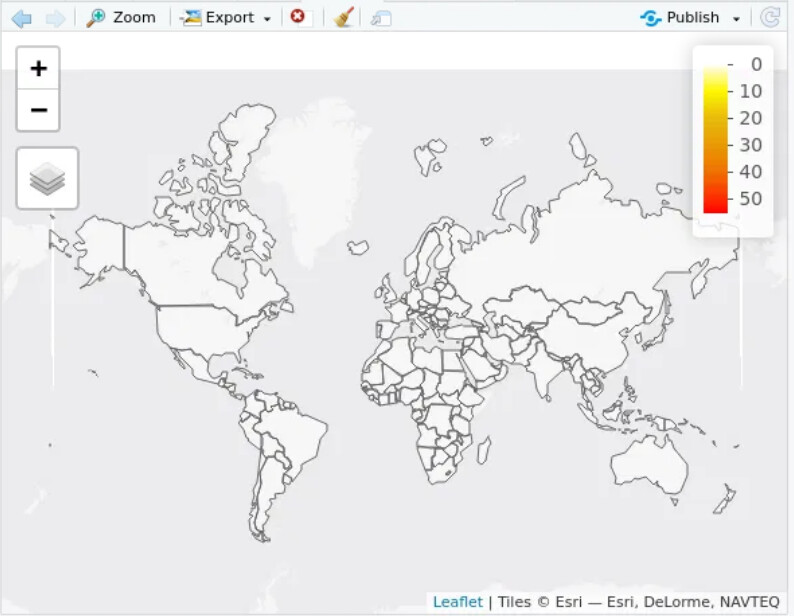
Also, I was able to produce static maps with tmap but I failed to use the interactive mode.
tmap_mode("view")
 tm_shape(ras_masked, raster.downsample = TRUE) +
 tm_raster(col="sum")

stars object downsampled to 1408 by 711 cells. See tm_shape manual (argument raster.downsample)
Error in if (diff(xlim) == 0 || diff(ylim) == 0) { :
  missing value where TRUE/FALSE needed
I think that it is due to what you was saying about downsampling .. but I thought that it was automatic in both mode view and plot ... do you know how to fix this issue?
The error you are seeing is definitely related to resizing of your raster; tmap automatically resizes rasters in static mode to 1e7 (ten million) cells and in interactive mode to 1e6 (one million) cells. Given that 1408 × 711 in your error message equals 1001088 I don't see it as a coincidence.
It is difficult to give advice without having access to your data, but two lines of thought are:
aggregating the raster yourself and finetuning the appearance - including whether you aggregate as mean or max, and how do you handle NAs. You probably want to try it for yourself; a good starting point for resolution will be taking the the expected resolution of your final final output, and doubling it.
within the framework of tmap increasing the value of max.raster for view mode to 1e7 (= a value which you have shown to work for static maps, and which it is the default in plot mode)
Thanks a lot ... it now works but I cannot see the pixel values in the view mode...
I aggregated the raster at a coarser resolution and changed the tmap options as you suggested ... but I cannot see the values of the raster layer ..which can be plotted nicely in plot mode
.. do you know the reason for this strange behaviour?
# Aggregate the raster for interactive plotting purpose
out_raster_agg=aggregate(out_raster, fact = 100, fun="max", na.rm=TRUE)

# Increase the maximum size of rasters, in terms of number of raster cells to be plotted.
# Rasters that are larger will be shown at a decreased resolution

tmap_options(max.raster = c(plot = 1e7, view = 1e7),
             basemaps.alpha=0.4)

col_b=c("white", "yellow","gold1",'goldenrod3', "orange2","darkorange2", "orangered1","red1")
mybreaks=seq(0,55,by=5)


tmap_mode("view")


tm_shape(World_ghe)+
  tm_borders()+
  tm_shape(out_raster_agg) +
  tm_raster(style = "cont",
            col = "focal_sum",
            palette = col_b,
            breaks = mybreaks,
            title = "")+
  tm_layout(legend.outside=TRUE)
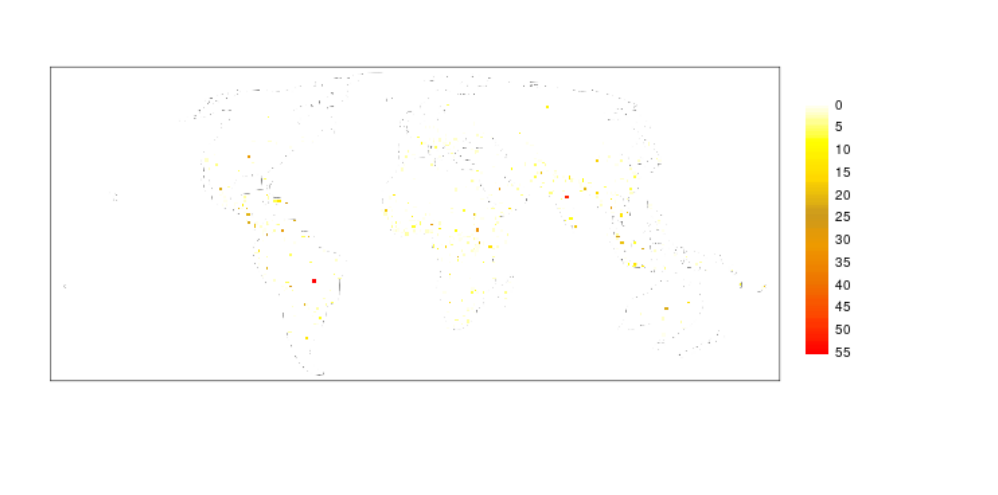
It is hard to make a definite comment without seeing your data - but my suspicion is that your raster is in some equal area projection, such as Mollweide or what not (when you squint hard you can make out the outline of the continents, and South America and Australia seem rather rounded).
Leaflet, and by extension tmap view mode, has difficulties with projections other than Web Mercator (EPSG:3857). The reason is twofold:
basemaps, which are pre-rendered, are in Web Mercator projection and cannot be easily changed on the fly
zooming and tessellation: web mercator projection has many faults, but it does project (most of) the globe onto a square; squares can be zoomed into smaller squares, and large squares can be put together
Mollweide doesn't work like this, and as consequence it is very uncommon to see it used in other context than world as a whole - which kind of beats the interactivity of a leaflet / tmap use case.
I would recomment using the package stars. This is a good resource for using that package, as wel as sf: Spatial Data Science - 7 Introduction to sf and stars
I often also write a raster map to an output file (e.g. .pdf or .jpeg) instead of trying to plot it in the RStudio plotting pane. The calculations often work fine, but plotting it in RStudio crashes.
Have you tried using the terra plot function? With terra library loaded and a spatraster called rast_new, you can just do plot(rest_new). All the usual options in base plot area available.