I give my model code above. It would be helpful to me to see how the code is developed using my variables. I have used ggplots2before with continuous variables but not binomial.
Here's an example on example data (as I dont have your data)
library(HSAUR3) # for example data
library(lme4)
library(ggeffects)
library(ggplot2)
gm2 <- glmer(outcome~treatment*visit+(1|patientID),
data=toenail,
family=binomial,nAGQ=20)
(step_1 <- ggpredict(gm2, terms = c("treatment", "visit")))
# the way you get it from ggeffects
plot(step_1)
#what does step_1 look like without the ggeffects print formatting ?
data.frame(step_1)
# doing it more manually
ggplot(data=step_1)+
aes(x=x,
color=group,
y=predicted,
ymin=conf.low,
ymax=conf.high) +
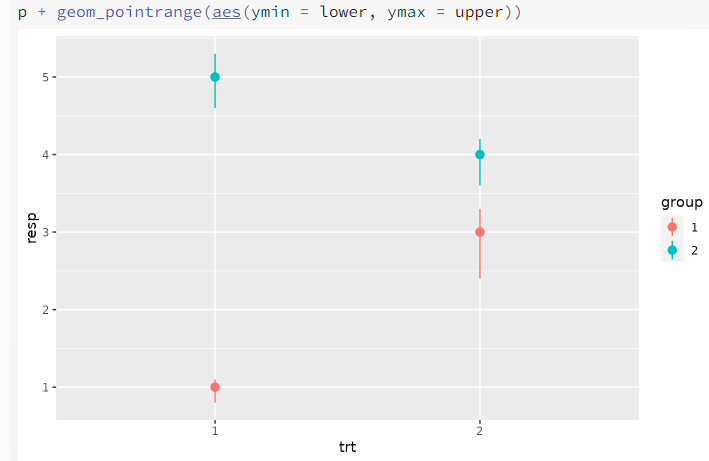
geom_pointrange(position = position_jitterdodge())