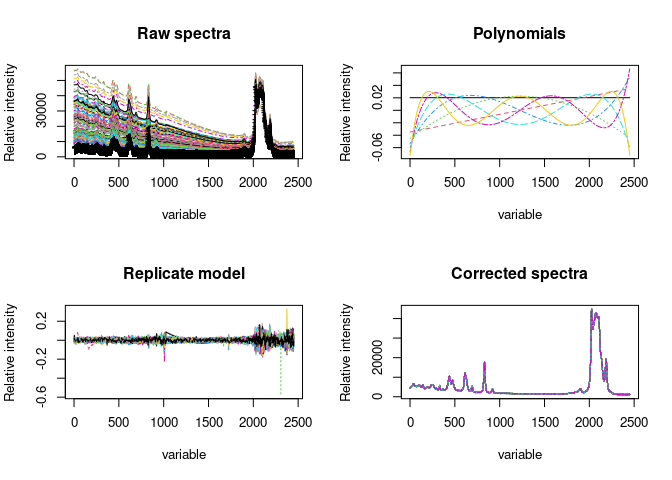
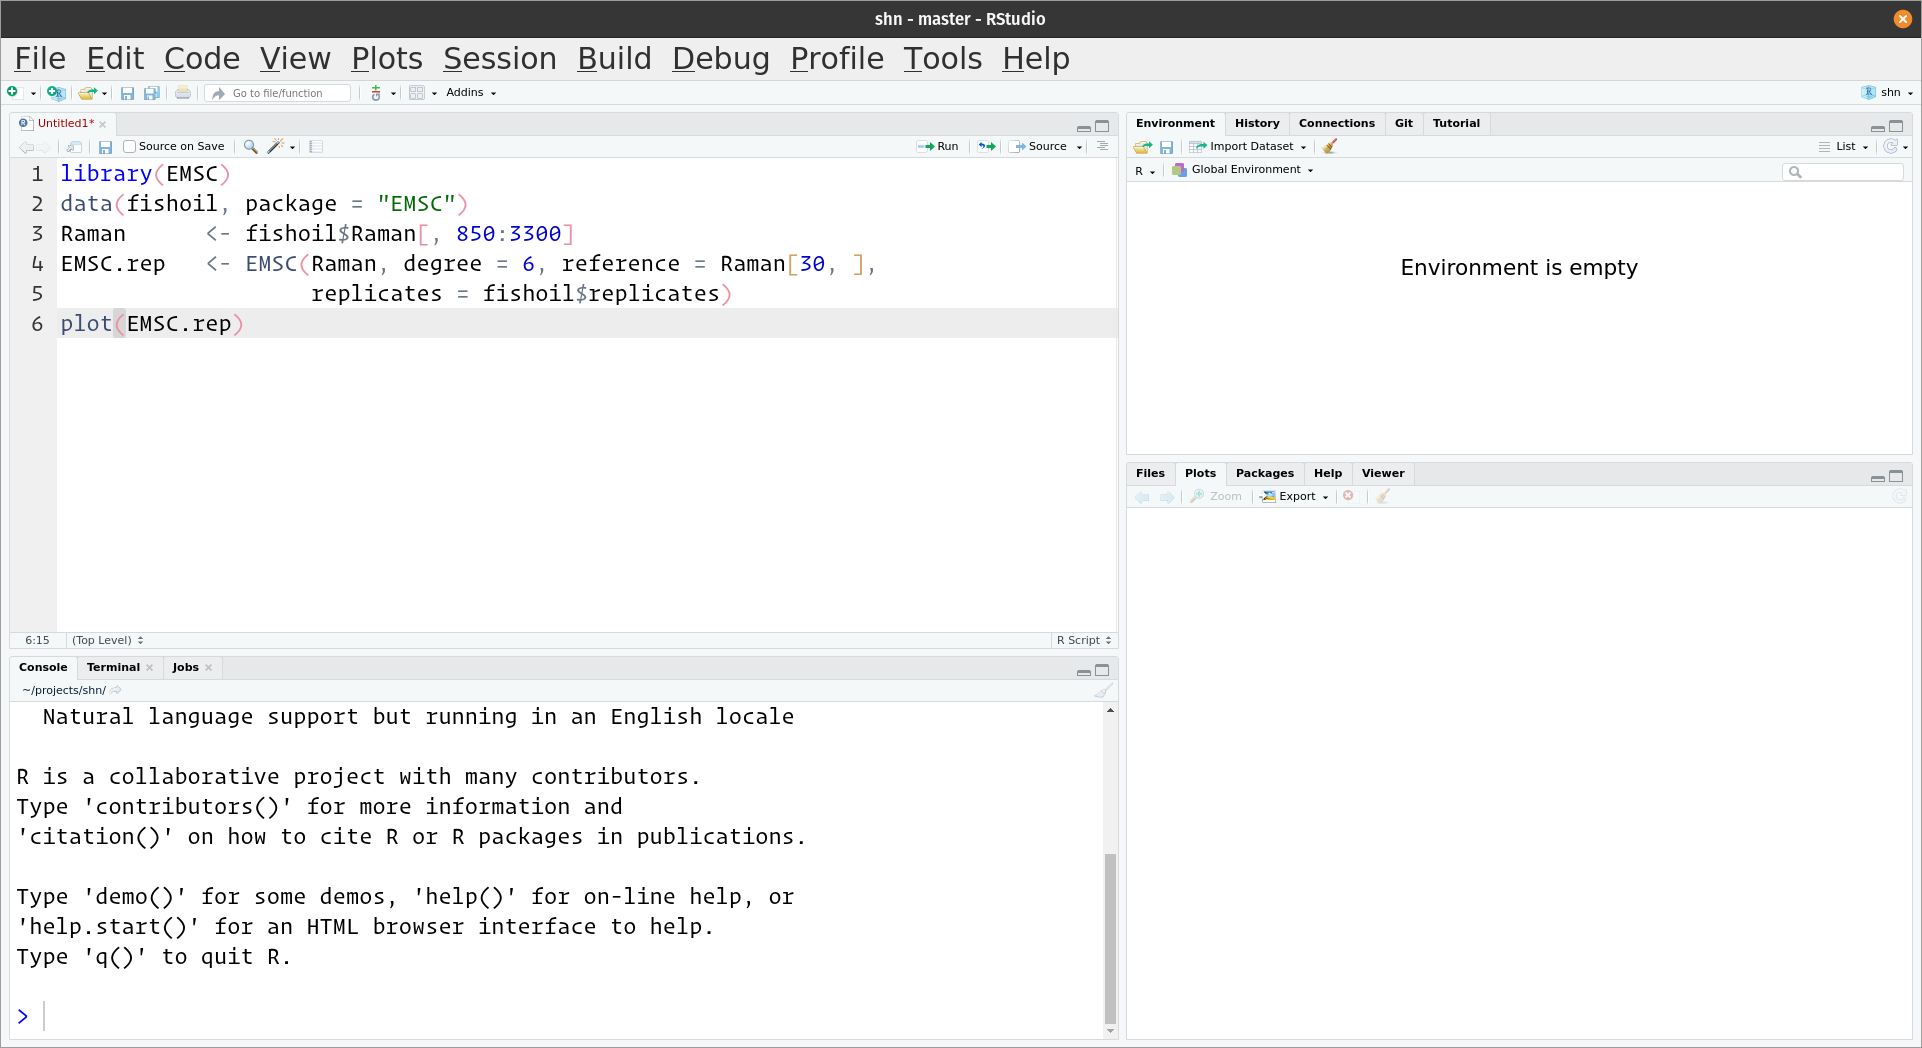
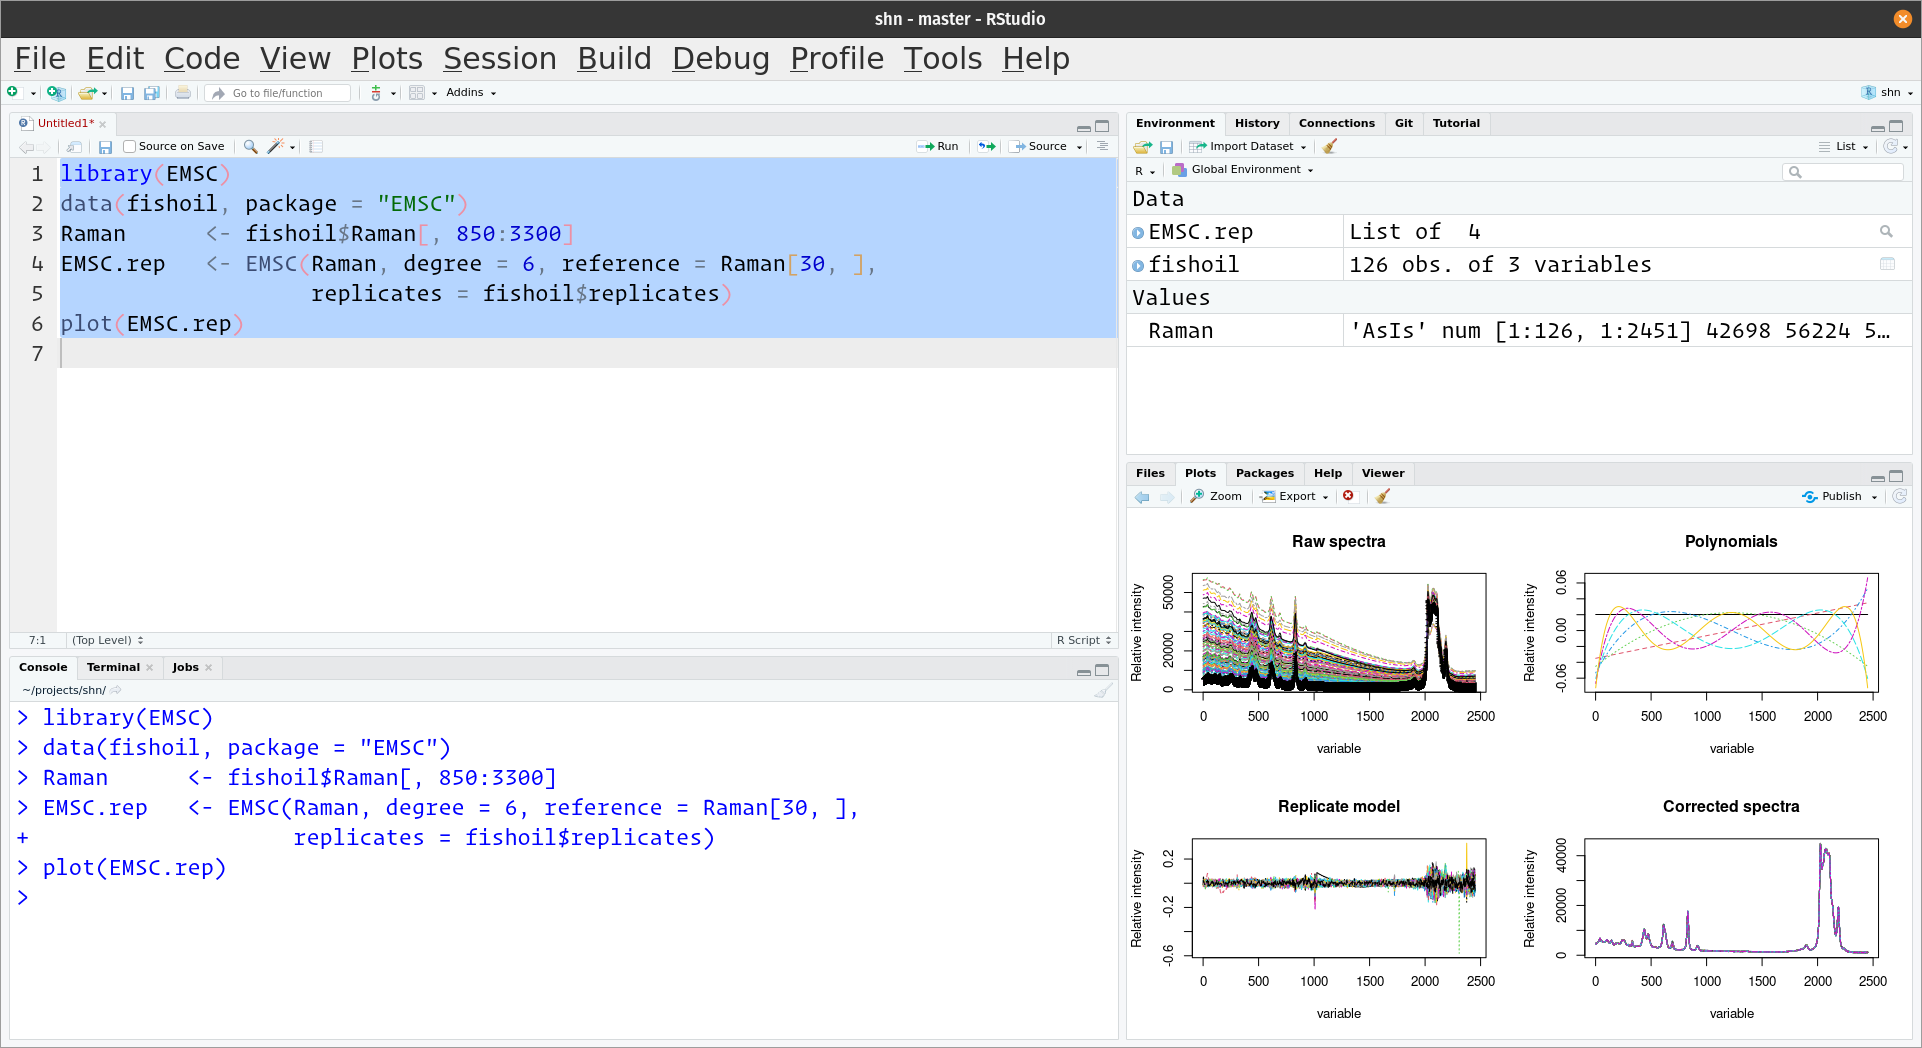
At the moment, I am trying to use an open access code (link) to process spectroscopy data. The purpose of this code is to suppress the effect of fluorescence. So as output data I'm supposed to have spectra without the effect of fluorescence (An example is available here : Run this example).
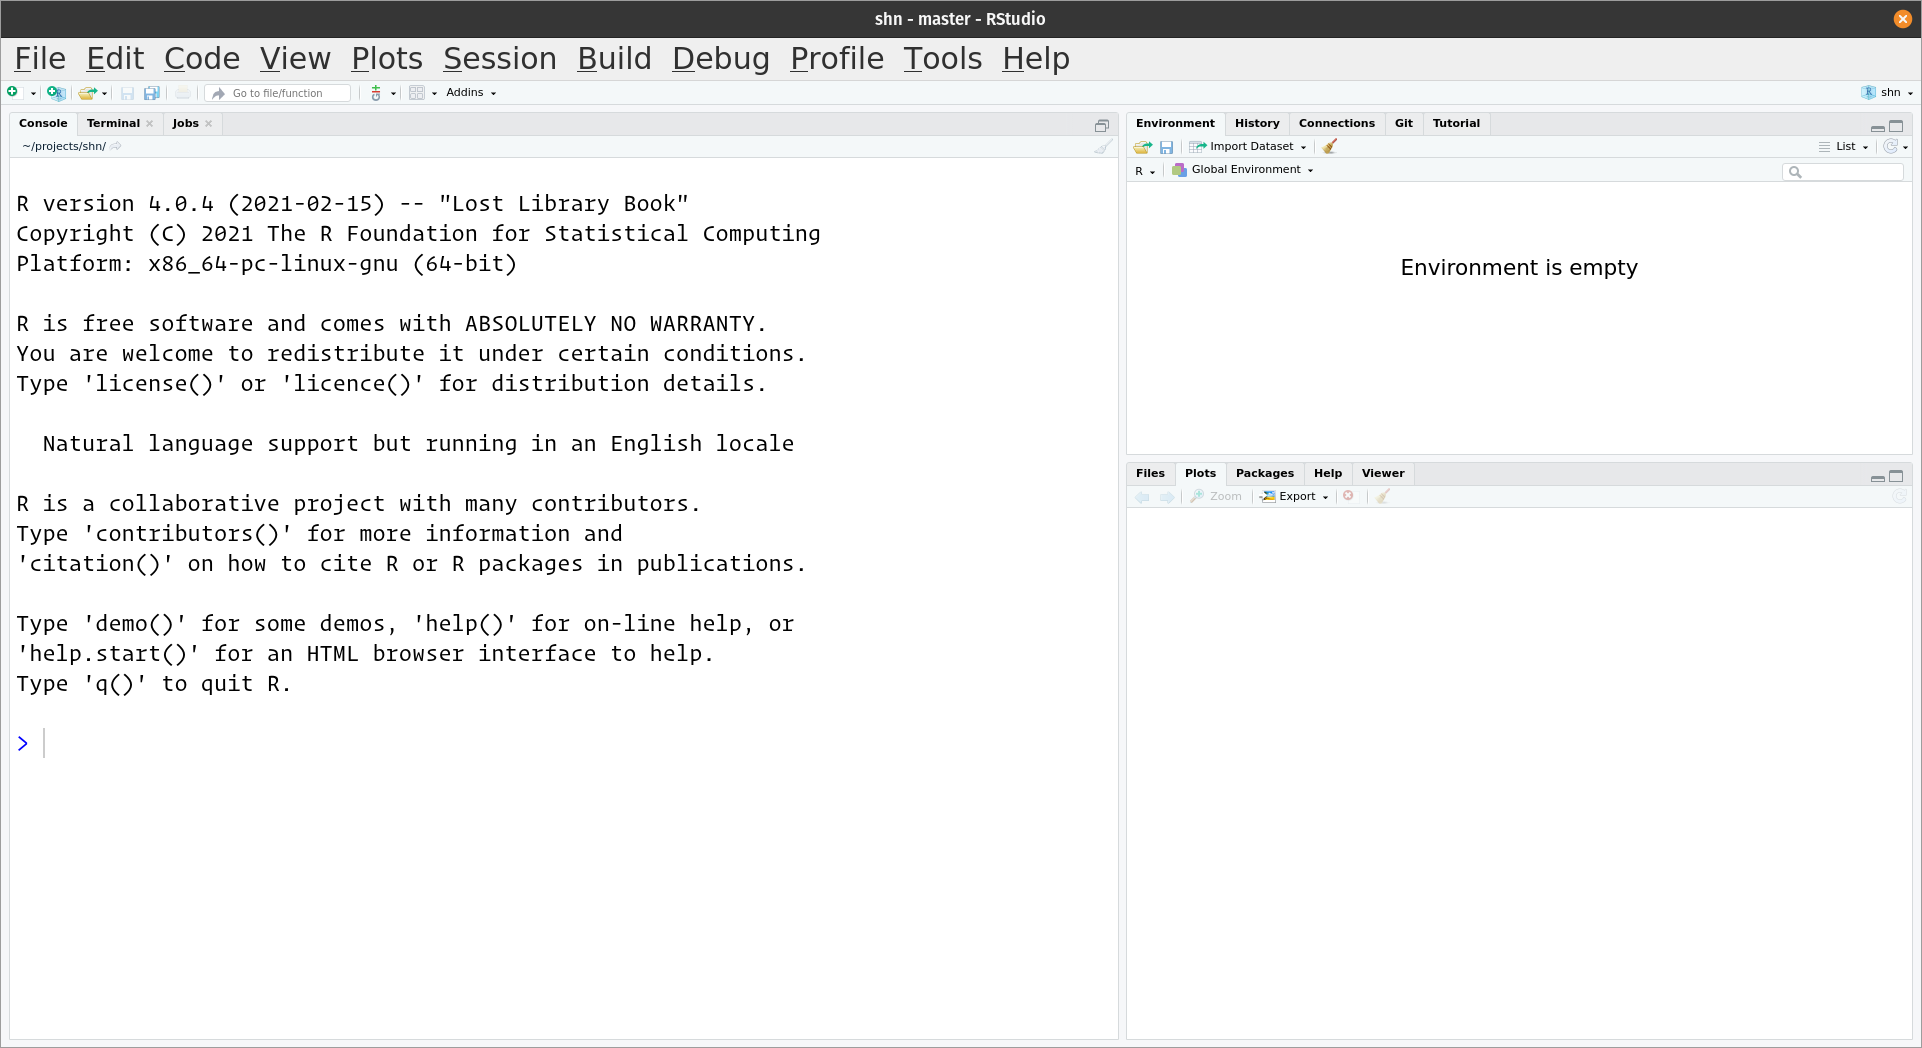
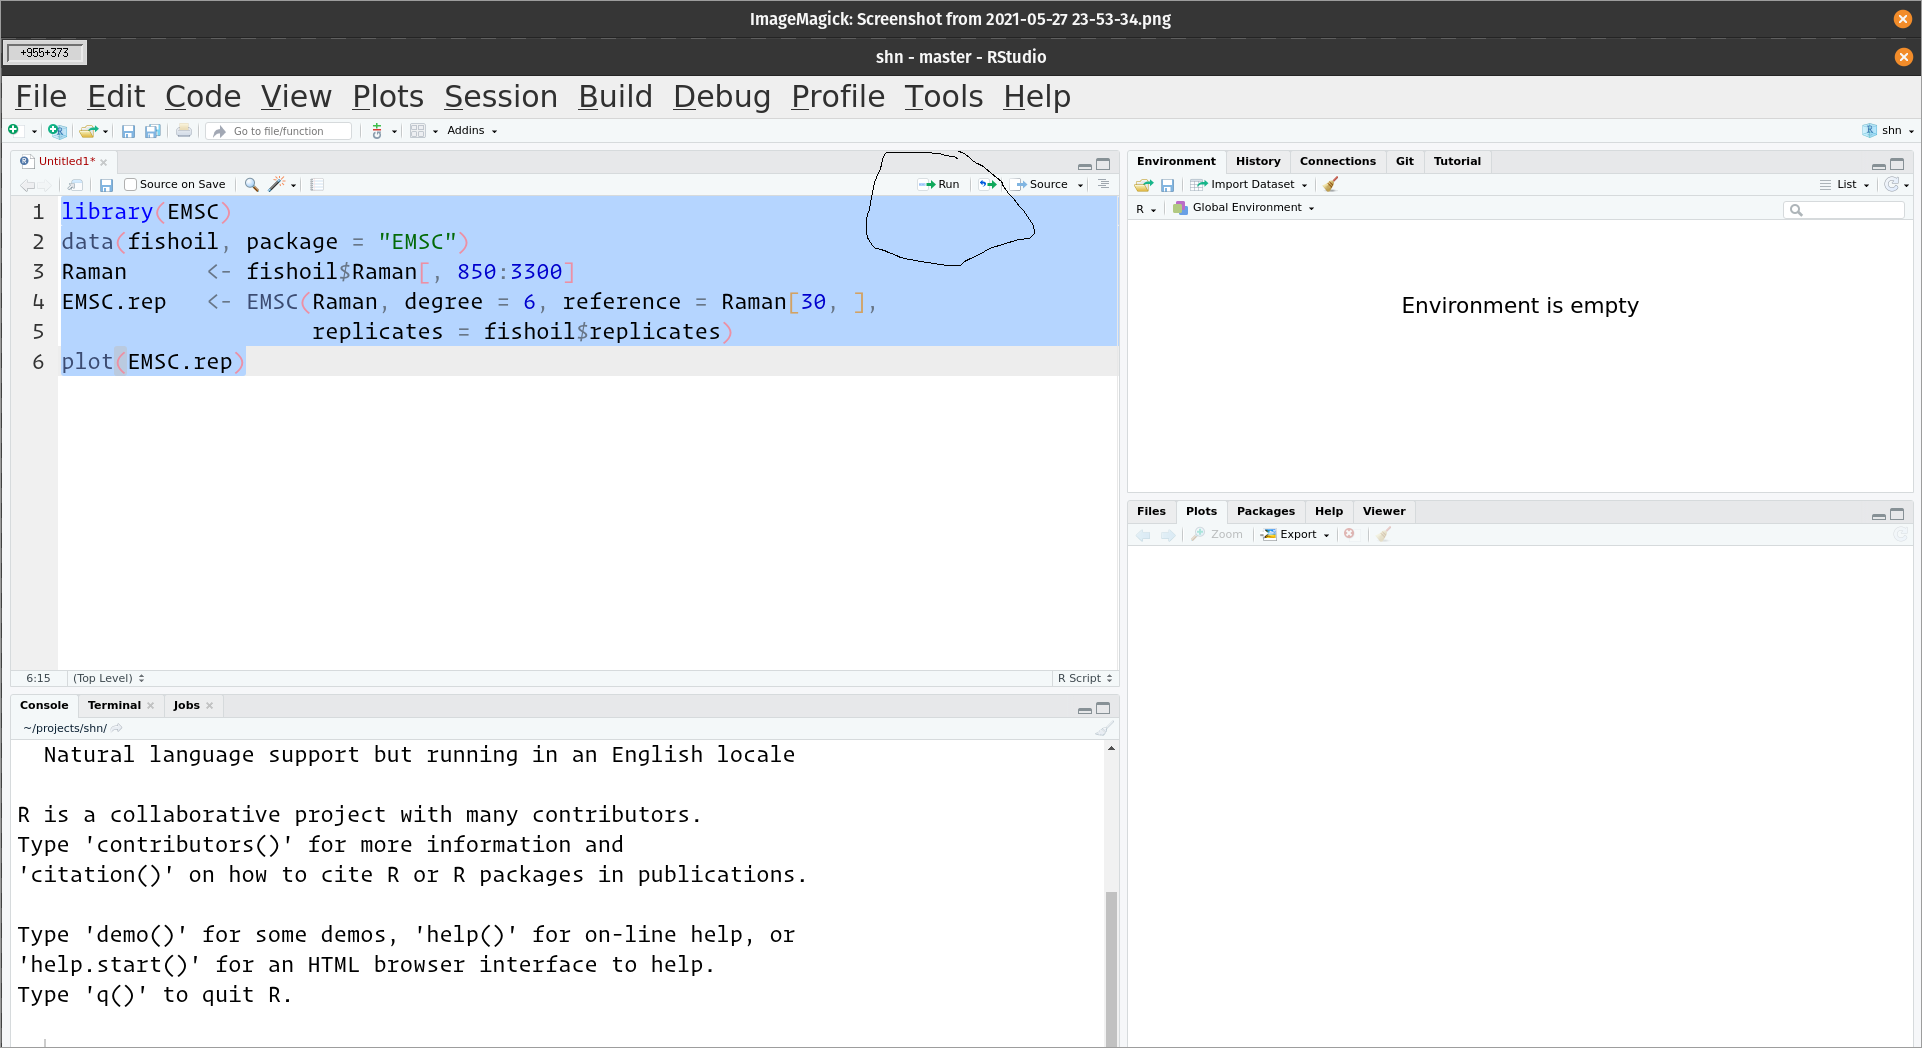
I am using Rstudio for the first time. However, I can't see the output data (Plot)
First of all, thank you for your answer. It seems that the code works for you.
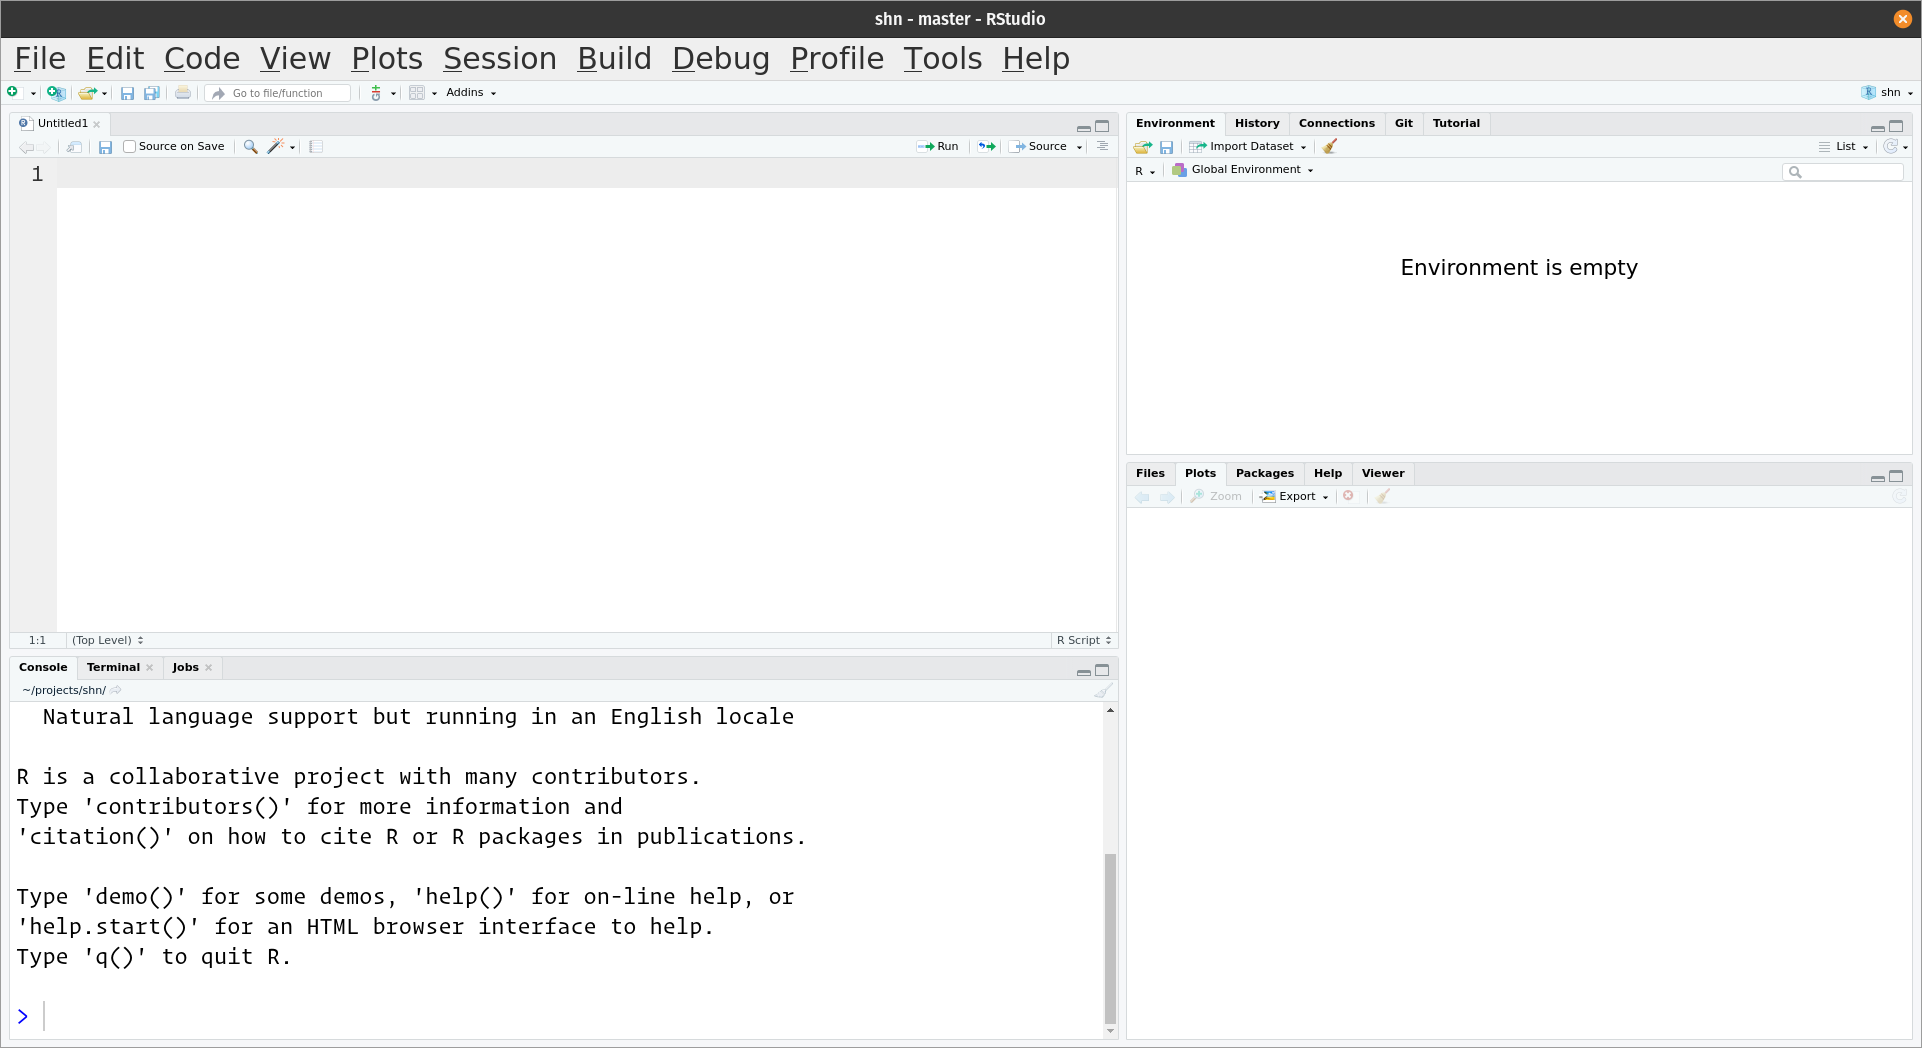
As it's the first time for me that I use the Rstudio, I'm a bit lost. Could you please tell me which file did you open first ? Shall I run any file from the code ?
If I could have more details that would be great (we can also discuss in private if you want).
Thank you for your understanding.
For your own data, it needs to be imported in place of the fishoil data frame. How to do that depends on its format and where it is located relative to the current directory that RStudio is operating in.