Plot Pollinator Plant Resource Preferences - Econullnetr

Hi, I've been using the package econullnetr to analyze a pollination network which includes 175 plants. I used the following code to plot the preferences:

plot_preferences(null.G, "Centris decolorata", signif.level = 0.95, style= "dots", type = "counts", xlab = "Num. of visits", p.cex = 1.2, lwd = 2)

The plots are too dense given there's a long list of connections. Is there a function I could use to divide the preference plot in two limiting the amount of plant species in each one?

Thank you!

Yes, create new null.G objects along the following lines

null.1 <- generate_null_net(WelshStreams[, 2:9], WelshStreams.prey[, 2:8],
  sims = 10, c.samples = WelshStreams[, 1],
  r.samples = WelshStreams.prey[, 1]
)

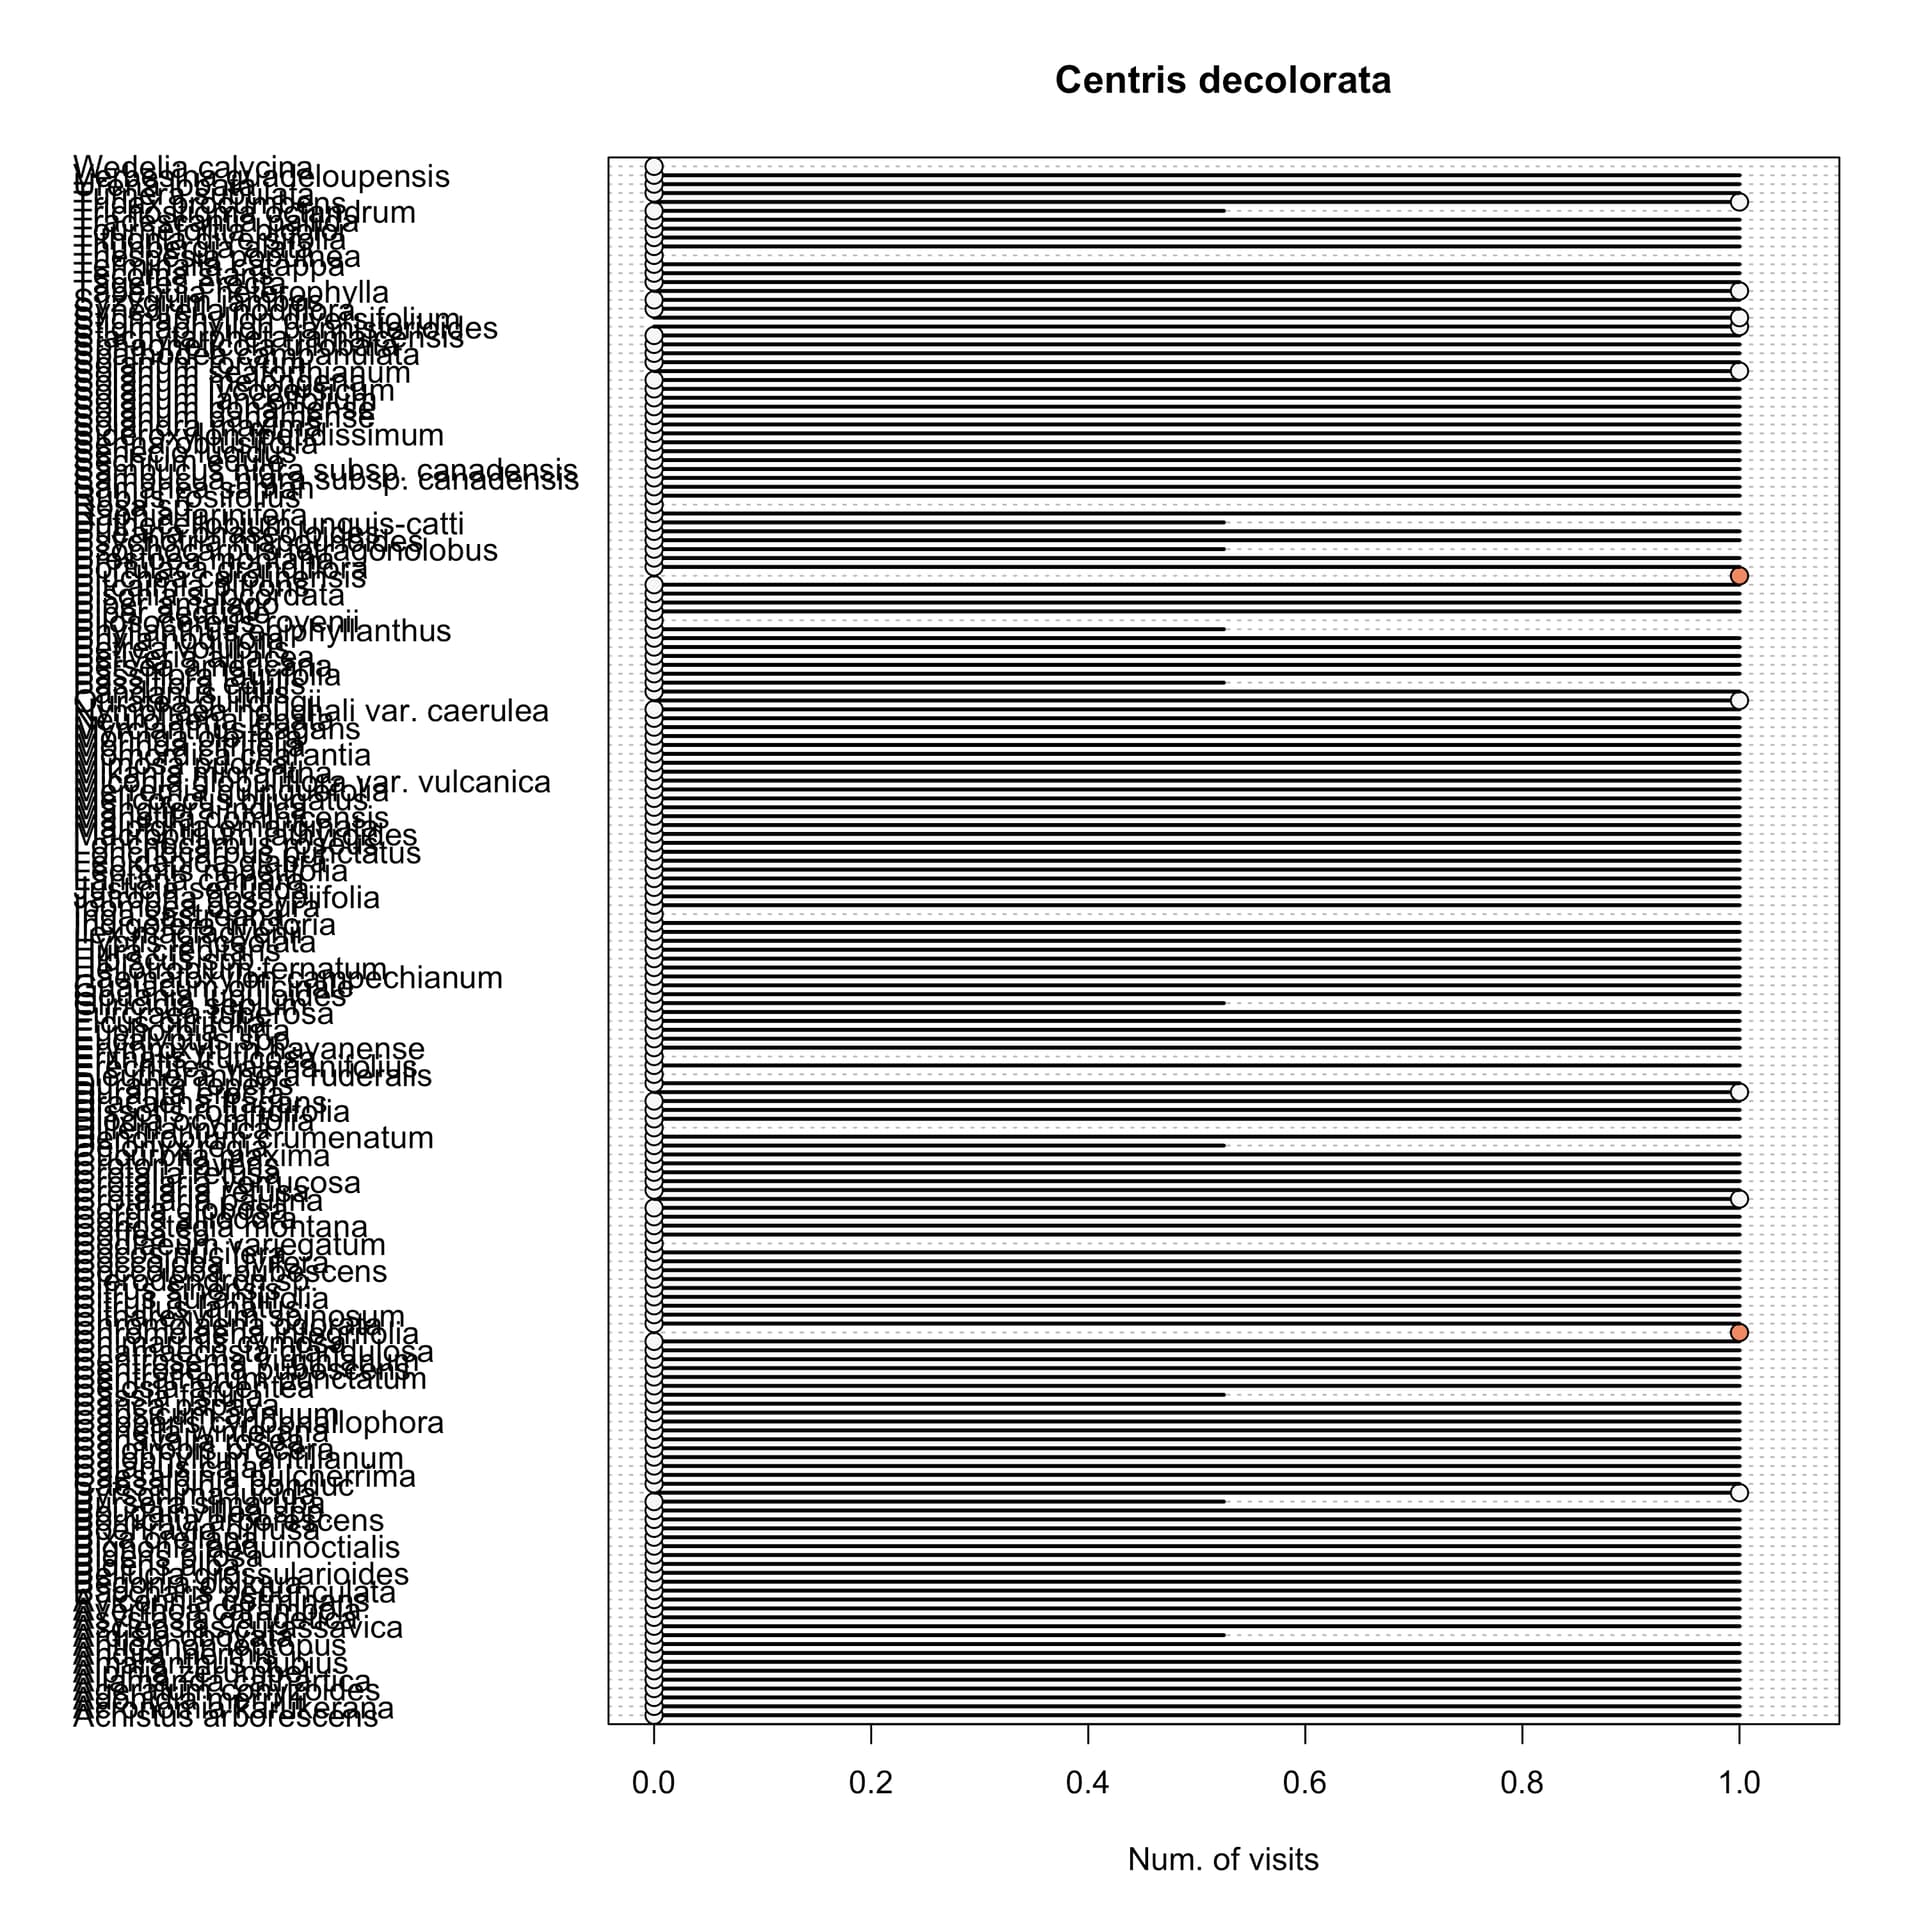
Changed from the example in help("plot_preferences"). However,
the data in your object make for a poor visualization even if the number of plants is reduced to a legible level. This is because almost all are either 1.0 or approximately 0.5? A table would be more legible and more comprehensible.

1 Like

Thank you for the feedback!

This topic was automatically closed 42 days after the last reply. New replies are no longer allowed.

If you have a query related to it or one of the replies, start a new topic and refer back with a link.