I am generating a net-split figure for a frequentist network meta-analysis. however, the figure is too large and I can only see/save part of it.
how can figure margins/size be adjusted to completely appear in the panel?
I have tried to maximize the panel window, but it didn't work.
thanks in advance
How are you generating the figure?
1 Like
Just using the net-split function in R.
However, I am not adding any specific things to it
Just: Netsplit(name of the analysis that I did)
Hi Basel,
It would be helpful for folks here if you shared the actual code you use to generate the plot, and maybe a screenshot that shows the issue, too.
Click on the "ZOOM" tab above the image.
I have tried everything already
clicking zoom, maximizing the "plot" panel.
none worked.
What happens if you restart R and RStudio and just plot something else?
Try
x <-  1
plot(x)
Can you supply your code and some sample data so we can see if we can duplicate the problem?
Just copy your code and paste it here between
```
```
A handy way to supply some sample data is the dput() function. In the case of a large dataset something like dput(head(mydata, 100)) should supply the data we need. Just do dput(mydata) where mydata is your data. Copy the output and paste it here between
```
```
The documentation for metafor::forest.rma explains what arguments are available to you to control the plot.
thanks for helping....
here is the code
forest(netsplit(hemostatic.netmeta.platform))
here is my sample ( I hope I am doing it correctly as you asked for):
structure(list(author = c("Jaemsuwan 2023", "Jaemsuwan 2023",
"Jaemsuwan 2023", "Zhao 2021", "Wu 2021", "Yimarj 2020", "Lorwicheanrung 2023",
"Lorwicheanrung 2023", "Lorwicheanrung 2023", "Lorwicheanrung 2023",
"Lorwicheanrung 2023", "Lorwicheanrung 2023", "Yotpibulwong 2023",
"Yotpibulwong 2023", "Yotpibulwong 2023", "Yotpibulwong 2023",
"Yotpibulwong 2023", "Yotpibulwong 2023", "Aydemir 2019", "Block 2017b",
"Block 2017", "Block 2017", "Block 2017", "Jorba-García 2023",
"Nomiyama 2023", "Margin 2019", "Varga 2020", "Varga 2020", "Varga 2020",
"Varga 2020", "Varga 2020", "Varga 2020", "Younes 2018", "Younes 2018",
"Younes 2018", "Wei 2022", "Schneider 2018", "Kaewsiri 2019",
"Feng 2022", "Smitkarn 2019", "Han 2021", "Farley 2013", "Shen 2015",
"Vercruyssen 2014", "Vercruyssen 2014", "Vercruyssen 2014", "Vercruyssen 2014",
"Vercruyssen 2014", "Vercruyssen 2014", "Sarhan 2021", "Lou 2021",
"Lou 2021", "Lou 2021", "Geng 2015", "Ngamprasertkit 2022", "Ochandiano 2022",
"Ochandiano 2022", "Ochandiano 2022", "Chandran 2023", "Søndergaard 2021",
"Ayman 2022", "Huang 2023"), TE = c(-1.6, -1.93, -0.33, -0.05,
-0.05, 0.2, -2.53, -2.5, -2.83, -0.02, -0.29, -0.32, -0.86, -0.42,
-0.46, -0.04, -0.44, -0.4, -0.69, -0.3, -0.47, -0.15, -0.62,
-0.58, -0.26, 0.41, -0.42, -0.45, -0.25, -0.17, 0.03, -0.2, -0.72,
-0.33, -0.39, -0.5, -0.67, -0.08, -0.07, -0.5, -0.13, -0.54,
-0.89, -1.44, -1.17, 0.2, -1.64, -0.27, -1.37, -1.48, -0.3, -0.66,
-0.36, 0.35, -0.26, -1.14, -0.04, -1.18, -1.87, -0.16, -0.78,
-0.59), seTE = c(0.5969, 0.6045, 0.5, 0.05, 0.09, 0.14, 0.33,
0.33, 0.34, 0.2653, 0.3163, 0.2142, 0.15, 0.17, 0.15, 0.1479,
0.15306, 0.1224, 0.02, 0.11, 0.076, 0.051, 0.08, 0.17, 0.14,
0.38, 0.15, 0.16836, 0.1836, 0.1479, 0.1326, 0.1683, 0.184, 0.179,
0.185, 0.22, 0.17, 0.11, 0.19, 0.18, 0.061, 0.37, 0.12, 0.24,
0.25, 0.2908, 0.2296, 0.1735, 0.2347, 0.46, 0.026, 0.036, 0.036,
0.17, 0.11, 0.3724, 0.3316, 0.301, 0.291, 0.3, 0.49, 0.1), treat1 = c("dCAIS",
"sCAIS", "sCAIS", "dCAIS", "dCAIS", "dCAIS", "sCAIS", "dCAIS",
"Comb", "sCAIS", "Comb", "Comb", "Comb", "sCAIS", "dCAIS", "dCAIS",
"Comb", "Comb", "dCAIS", "dCAIS", "dCAIS.part", "dCAIS", "dCAIS",
"dCAIS", "sCAIS", "sCAIS", "sCAIS", "sCAIS.part", "sCAIS.pilot",
"sCAIS", "sCAIS", "sCAIS.part", "sCAIS", "sCAIS.pilot", "sCAIS",
"dCAIS", "sCAIS", "sCAIS", "sCAIS", "sCAIS", "sCAIS", "sCAIS",
"sCAIS", "sCAIS", "sCAIS.part", "sCAIS.pilot", "sCAIS", "sCAIS",
"sCAIS.part", "sCAIS", "sCAIS", "sCAIS", "sCAIS.part", "sCAIS",
"sCAIS", "sCAIS", "Comb", "Comb", "sCAIS", "sCAIS", "sCAIS",
"sCAIS"), treat2 = c("FH", "FH", "dCAIS", "sCAIS", "sCAIS", "sCAIS",
"FH", "FH", "FH", "dCAIS", "sCAIS", "dCAIS", "FH", "FH", "FH",
"sCAIS", "sCAIS", "dCAIS", "FH", "FH", "FH", "dCAIS.part", "FH",
"FH", "FH", "FH", "FH", "FH", "FH", "sCAIS.pilot", "sCAIS.part",
"sCAIS.pilot", "FH", "FH", "sCAIS.pilot", "FH", "FH", "dCAIS",
"dCAIS", "FH", "FH", "FH", "FH", "FH", "FH", "FH", "sCAIS.pilot",
"sCAIS.part", "sCAIS.pilot", "sCAIS.part", "sCAIS.part", "FH",
"FH", "sCAIS.part", "sCAIS.part", "dCAIS", "sCAIS", "dCAIS",
"FH", "FH", "FH", "FH"), treat1.long = c("Dynamic.navigation",
"Static.guided", "Static.guided", "Dynamic.navigation", "Dynamic.navigation",
"Dynamic.navigation", "Static.guided", "Dynamic.navigation",
"Combination", "Static.guided", "Combination", "Combination",
"Combination", "Static.guided", "Dynamic.navigation", "Dynamic.navigation",
"Combination", "Combination", "Dynamic.navigation", "Dynamic.navigation",
"Dynamic.navigation.partial", "Dynamic.navigation", "Dynamic.navigation",
"Dynamic.navigation", "Static.guided", "Static.guided", "Static.guided",
"Static.guided.partial", "Static.guided.pilot", "Static.guided",
"Static.guided", "Static.guided.partial", "Static.guided", "Static.guided.pilot",
"Static.guided", "Dynamic.navigation", "Static.guided", "Static.guided",
"Static.guided", "Static.guided", "Static.guided", "Static.guided",
"Static.guided", "Static.guided", "Static.guided.partial", "Static.guided.pilot",
"Static.guided", "Static.guided", "Static.guided.partial", "Static.guided",
"Static.guided", "Static.guided", "Static.guided.partial", "Static.guided",
"Static.guided", "Static.guided", "Combination", "Combination",
"Static.guided", "Static.guided", "Static.guided", "Static.guided"
), treat2.long = c("Freehand", "Freehand", "Dynamic.navigation",
"Static.guided", "Static.guided", "Static.guided", "Freehand",
"Freehand", "Freehand", "Dynamic.navigation", "Static.guided",
"Dynamic.navigation", "Freehand", "Freehand", "Freehand", "Static.guided",
"Static.guided", "Dynamic.navigation", "Freehand", "Freehand",
"Freehand", "Dynamic.navigation.partial", "Freehand", "Freehand",
"Freehand", "Freehand", "Freehand", "Freehand", "Freehand", "Static.guided.pilot",
"Static.guided.partial", "Static.guided.pilot", "Freehand", "Freehand",
"Static.guided.pilot", "Freehand", "Freehand", "Dynamic.navigation",
"Dynamic.navigation", "Freehand", "Freehand", "Freehand", "Freehand",
"Freehand", "Freehand", "Freehand", "Static.guided.pilot", "Static.guided.partial",
"Static.guided.pilot", "Static.guided.partial", "Static.guided.partial",
"Freehand", "Freehand", "Static.guided.partial", "Static.guided.partial",
"Dynamic.navigation", "Static.guided", "Dynamic.navigation",
"Freehand", "Freehand", "Freehand", "Freehand"), versus = c("dCAIS vs FH",
"sCAIS vs FH", "sCAIS vs dCAIS", "dCAIS vs sCAIS", "dCAIS vs sCAIS",
"dCAIS vs sCAIS", "sCAIS vs FH", "dCAIS vs FH", "Comb vs FH",
"dCAIS vs sCAIS", "Comb vs sCAIS", "Comb vs dCAIS", "Comb vs FH",
"sCAIS vs FH", "dCAIS vs FH", "dCAIS vs sCAIS", "Comb vs sCAIS",
"Comb vs dCAIS", "dCAIS vs FH", "dCAIS vs FH", "dCAIS.part vs FH",
"dCAIS vs dCAIS.part", "dCAIS vs FH", "dCAIS vs FH", "sCAIS vs FH",
"sCAIS vs FH", "sCAIS vs FH", "sCAIS.part vs FH", "sCAIS.pilot vs FH",
NA, "sCAIS vs sCAIS.part", "sCAIS.part vs sCAIS.pilot", "sCAIS vs FH",
"sCAIS.pilot vs FH", "sCAIS vs sCAIS.pilot", "dCAIS vs FH", "sCAIS vs FH",
"sCAIS vs dCAIS", "sCAIS vs dCAIS", "sCAIS vs FH", "sCAIS vs FH",
"sCAIS vs FH", "sCAIS vs FH", "sCAIS vs FH", "sCAIS.part vs FH",
"sCAIS.pilot vs FH", NA, "sCAIS vs sCAIS.part", "sCAIS.part vs sCAIS.pilot",
"sCAIS vs sCAIS.part", "sCAIS vs sCAIS.part", "sCAIS vs FH",
"sCAIS.part vs FH", "sCAIS vs sCAIS.part", "sCAIS vs sCAIS.part",
"sCAIS vs dCAIS", "Comb vs sCAIS", "Comb vs dCAIS", "sCAIS vs FH",
"sCAIS vs FH", "sCAIS vs FH", "sCAIS vs FH")), class = c("tbl_df",
"tbl", "data.frame"), row.names = c(NA, -62L))
Thanks, the data seems fine.
We really need to see all of your code. I am not familiar with {meta} or {netmeta} and I have no idea what you ar doing to get from your data.frame to "hemostatic.netmeta.platform" which, I guess, is a "netmeta" class object.
here is the full code to generate the network (in a network meta-analysis)
m.netmeta.angle <- netmeta(TE = TE, seTE = seTE, treat1 = treat1, treat2 = treat2, studlab = author, data = angular_deviation_frequentist, sm = "MD", comb.fixed = FALSE, comb.random = TRUE, reference.group = "FH", details.chkmultiarm = TRUE, sep.trts = "vs", tol.multiarm = 0.5)
note that "angular_deviation_frequentist" is just the name of the dataset
then I am using the forest net-split code that I mentioned earlier to generate the figure
Where is this coming from?
BTW, it is a good idea to paste code between
```
```
It gives a better formatted code.
In order to help folks here help you, it's important that the code you share be self-contained, meaning that it include both enough data to recreate the issue as well as all of the intermediate step you've taken.
For example, if you had shared the output of
dput(m.netmeta.platform)
from the screenshot you shared, then folks here could have run
forest(netsplit(m.netmeta.platform))
to recreate your output.
It's also not clear what code you ran to produce this output:
Is the above the output of this code?
dput(hemostatic.netmeta.platform)
it is the output of this code:
dput(m.netmeta.platform)
here are the steps I'm doing
I load the netmeta and dmetar packages
I import the data (the one I showed above)
I run the following code to generate the outcome of the network meta-analysis
,,,,,,,,,,,
m.netmeta.platform <- netmeta(TE = TE, seTE = seTE, treat1 = treat1, treat2 = treat2, studlab = author, data = platform_deviation_frequentist, sm = "MD", comb.fixed = FALSE, comb.random = TRUE, reference.group = "FH", details.chkmultiarm = TRUE, sep.trts = "vs", tol.multiarm = 0.5)
,,,,,,,,,,,,,
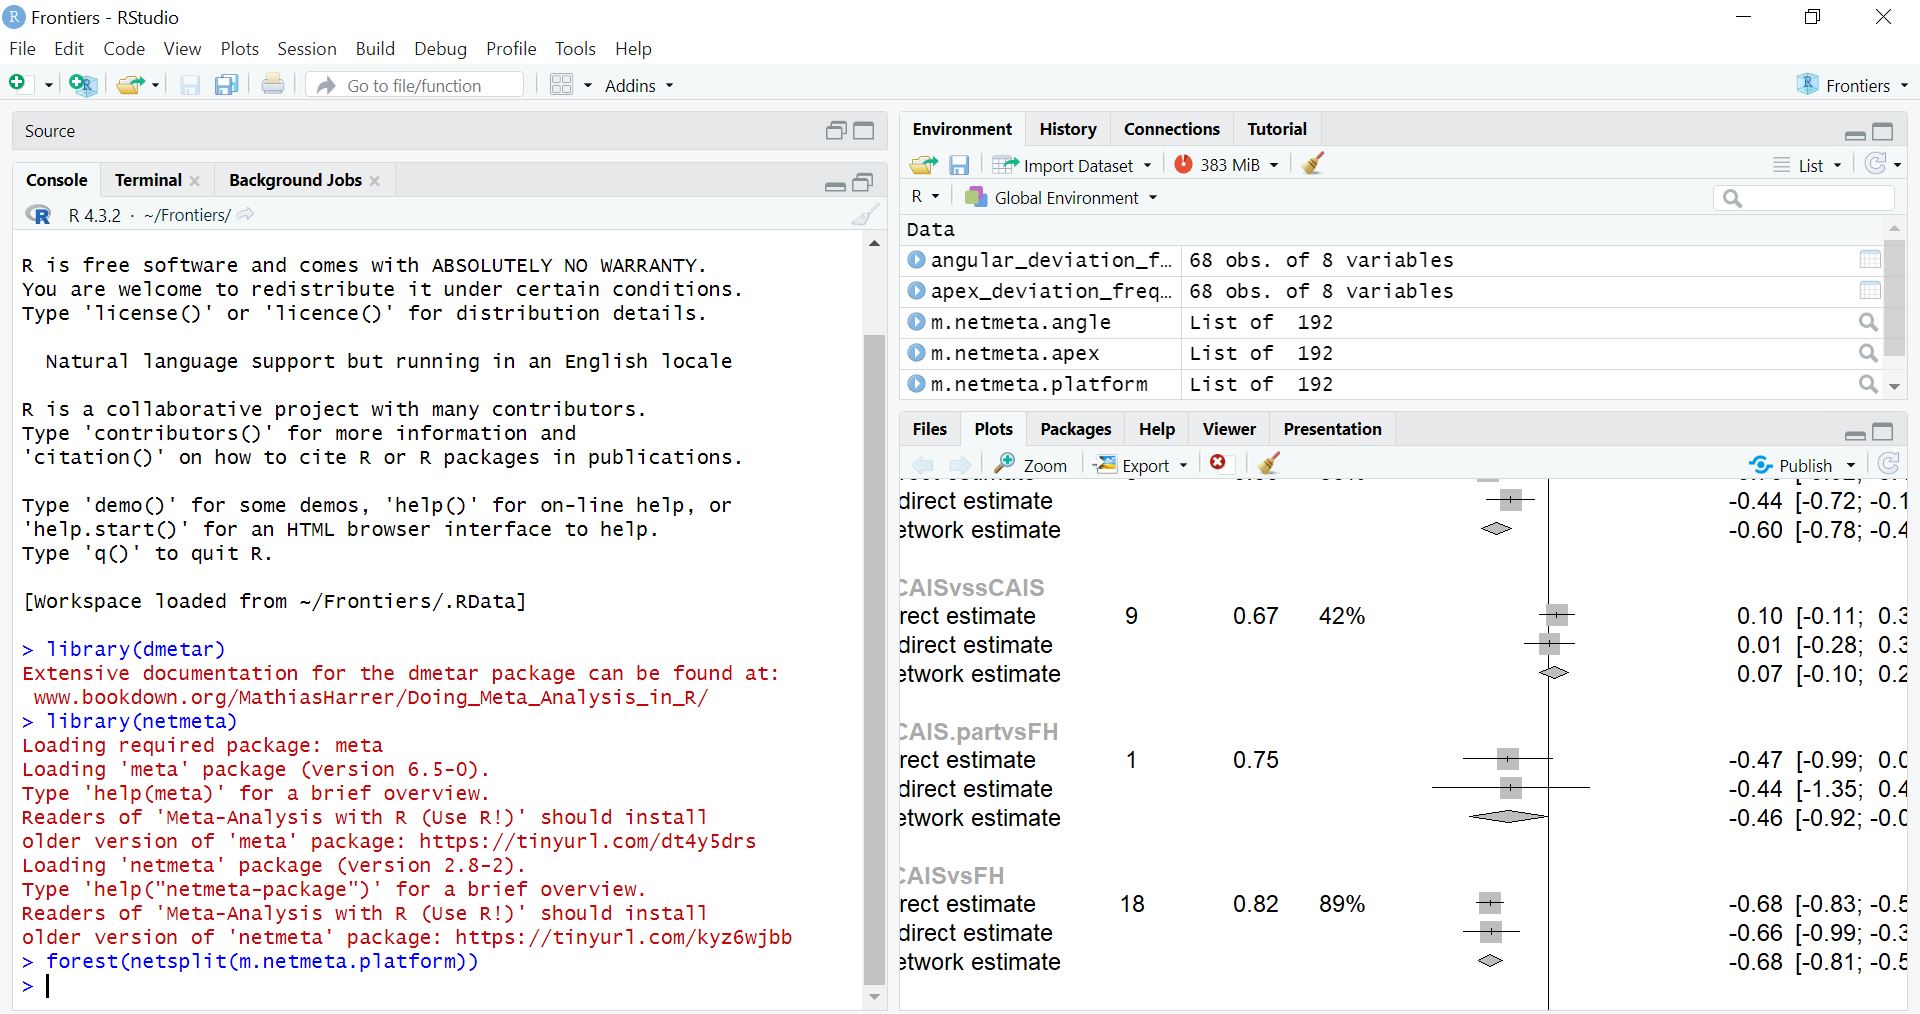
then I run the code below to generate the net-split figure (which is the one I am having a problem with
,,,,,,,,,,,,,,,,,,,,,,,,
forest(netsplit(m.netmeta.platform))
,,,,,,,,,,,,,,,,,,,,
that's the name of the file (dataset), not the code.
here is the code I am using:
,,,,,,,,,,,,,,,,,,,,,,,,,,,
m.netmeta.platform <- netmeta(TE = TE, seTE = seTE, treat1 = treat1, treat2 = treat2, studlab = author, data = platform_deviation_frequentist, sm = "MD", comb.fixed = FALSE, comb.random = TRUE, reference.group = "FH", details.chkmultiarm = TRUE, sep.trts = "vs", tol.multiarm = 0.5)
,,,,,,,,,,,,,,,,,,,,,,,,,,,
You are not supplying all of your code.
We need to see something like this:
library(dmetar)
library(netmeta)

angular_deviation_frequentist <- read.csv("raw_data.csv")

m.netmeta.angle <- netmeta(TE = TE, seTE = seTE, treat1 = treat1, treat2 = treat2,
  studlab = author, data = angular_deviation_frequentist, sm = "MD",
  comb.fixed = FALSE, comb.random = TRUE, reference.group = "FH",
  details.chkmultiarm = TRUE, sep.trts = "vs", tol.multiarm = 0.5)
And then the rest of your code that produces
platform_deviation_frequentist
Please paste the code between
```
```
for readability.
This is in contradiction with your screenshot since the output is not of class "netmeta", which is required by the netsplit() function.
As I mentioned above:
One way to do this would be to:
- Recreate the deficient forest plot.
- Immediately afterwards, post the statement you just used to recreate the deficient plot.
- Immediately after that, post the output of
dput()for any object you named in the statement from step 2.
Also, note that ''' is not that same as ```: The latter is three backticks, which is what you need to place before and after any code you share here.
If you follow these steps carefully, folks here will be able to reproduce your plot and be in a position to try to help.
This topic was automatically closed 90 days after the last reply. New replies are no longer allowed.
If you have a query related to it or one of the replies, start a new topic and refer back with a link.