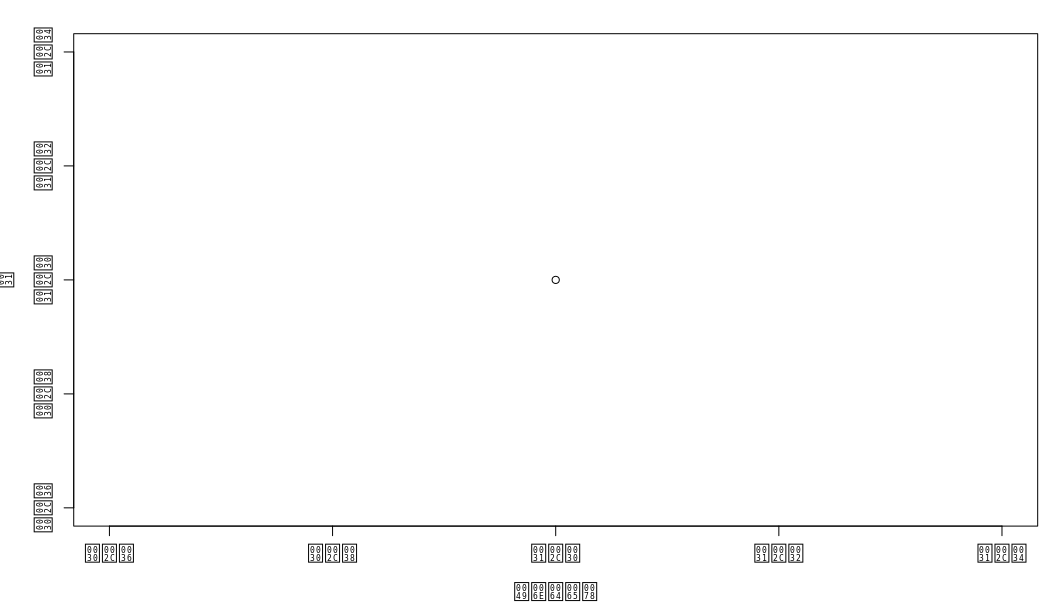
How to fix this? Labels och titles not showing up correctly in rstudio.
plot(1)
Hello Aurany,
Welcome to the forum  We'd be happy to help you if you can at least provide some code and data. That way we can actively help you to get the plot to show correctly.
Can you just maybe also add which version and operating system you're using?
Thank you! =)
I ran the following code:
plot(1)
sessionInfo() prints:
R version 3.6.1 (2019-07-05)
Platform: x86_64-conda_cos6-linux-gnu (64-bit)
Running under: Ubuntu 18.04.5 LTS

Matrix products: default
BLAS/LAPACK: /home/rasmus/miniconda3/envs/anarchy/lib/R/lib/libRblas.so

locale:
 [1] LC_CTYPE=en_US.UTF-8          LC_NUMERIC=sv_SE.UTF-8        LC_TIME=sv_SE.UTF-8           LC_COLLATE=en_US.UTF-8
 [5] LC_MONETARY=sv_SE.UTF-8       LC_MESSAGES=en_US.UTF-8       LC_PAPER=sv_SE.UTF-8          LC_NAME=sv_SE.UTF-8
 [9] LC_ADDRESS=sv_SE.UTF-8        LC_TELEPHONE=sv_SE.UTF-8      LC_MEASUREMENT=sv_SE.UTF-8    LC_IDENTIFICATION=sv_SE.UTF-8

attached base packages:
[1] stats     graphics  grDevices utils     datasets  methods   base

loaded via a namespace (and not attached):
[1] compiler_3.6.1 tools_3.6.1    yaml_2.2.0
This topic was automatically closed 21 days after the last reply. New replies are no longer allowed.