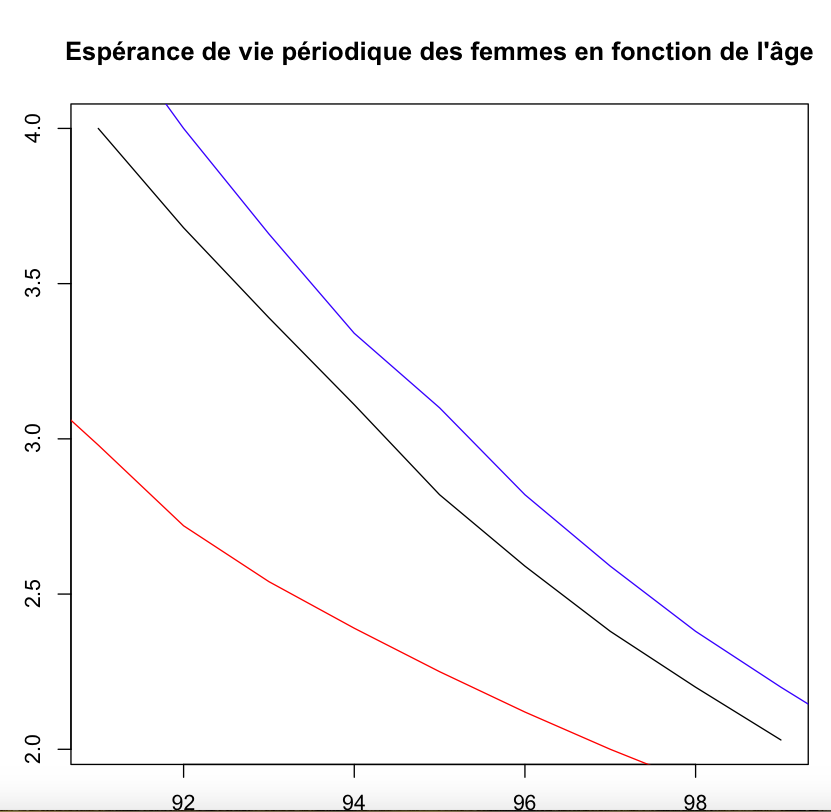
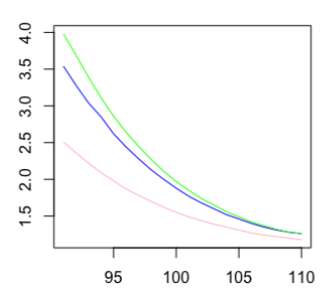
Hello, I want to plot a subset of my data respecting 2 conditions. I wrote a code in order to do it and it works well but the graph I get is only a part of the data that should be represented. Indeed in my data I have ages from 0 to 110 and when I plot with the condition Age > 90 I only get the data from Age 90 to 100.
This is my code
plot(ex ~ Age, data=subset(female.period.lifetable_1x1, Year == 2020 & Age > 90), type = "l", xlab ="Age", ylab = "E(x)", main = "Espérance de vie périodique des femmes en fonction de l'âge")
lines(x = female.period.lifetable_1x1$ex[female.period.lifetable_1x1$Year == 2015], col = "blue")
lines(x = female.period.lifetable_1x1$ex[female.period.lifetable_1x1$Year == 1955 ], col = "red")
legend(80, 80, legend=c("2020", "2015", "1955"),
col=c("blue", "black","red"), lty = 1:1,
title="Period", text.font=4, bg='lightblue')
This is the graph I get
and this is the graph I need
And when I use the same code but with the condition Age > 100 instead of Age > 90 and I get the graph for all ages like there was no condition.
Could someone tell me what is going wrong?
Thanks in advance
Hello.
Thanks for providing code , but you could take further steps to make it more convenient for other forum users to help you.
Share some representative data that will enable your code to run and show the problematic behaviour.
You might use tools such as the library datapasta, or the base function dput() to share a portion of data in code form, i.e. that can be copied from forum and pasted to R session.
Reprex Guide
Hi @Diego17,
You can set the limits of the x and y axis in your original plot() call. Make sure you set it to values that capture the domain of all of the lines.
plot(..., xlim = c(x1, x2), ylim = c(y1, y2))
I tried the functions you cited but I don't understand how to use it. However by asking me this I was then checking my data to describe it and I understood my problem. The Age column is a charachter column and not a numeric one.
I solved my problem by doing
plot(ex ~ Age, data=subset(female.period.lifetable_1x1, Year == 2020 & as.numeric(Age) > 90))
Glad your problem was solved, I often too fix my faults in the course of attempting to make an issue reproducible, its a nice brain hack in a sense.
Down the road, if you want to offer advice as to how the reprex guide might be improved, I'd be all ears as it's our go to FAQ that almost all first timers to the boards will be asked to read at some point.
All the best.