Plot not displaying in R shiny

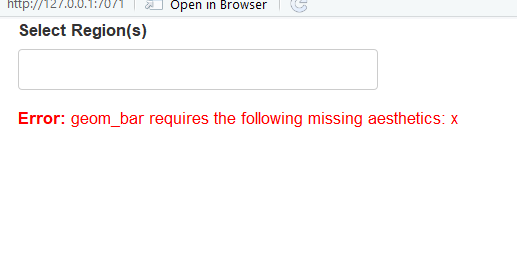
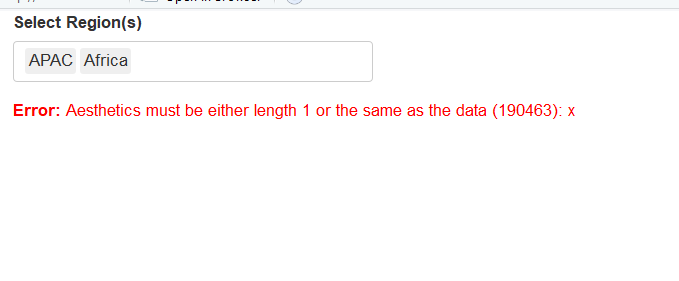
I have a bar plot which i want to display in R shiny based on one/multiple user input selection.But it gives an error and thereby doesn't display.The code is as below:-

unique(df3_machine_region$Region)

unique(df3_machine_region$Region)
[1] "Europe" "Americas" "APAC" "Africa" "PDO" "UK"

R shiny code:-

knitr::opts_chunk$set(echo = TRUE)
library(shiny)
ui <- fluidPage(
selectInput("Region","Select Region(s)",unique(df3_machine_region$Region),multiple=TRUE),
plotOutput("Plot1")
)
server <- function(input, output) {
output$Plot1 <- renderPlot(
ggplot(df3_machine_region,aes(x=input$Region,sum_as_hours)) +
geom_bar(stat="identity", fill="steelblue")+
theme_minimal())
}
shinyApp(ui = ui, server = server)

When i run the above code,it shows this error initially:-

image

After that,when i select few values,it gives the below error:-

image

Hi @ritm, I can't reproduce the error because you haven't shared the full dataset df3_machine_region.

But, I think the problem is that you are supplying a vector of values to ggplot while it expects a column name. The sum_as_hours is a column as well I guess?

Here is an example how to do this, with a dataset that's available in R

library(shiny)
library(ggplot2)
library(dplyr)

ui <- fluidPage(
  selectInput("Region","Select Region(s)", unique(iris$Species), multiple=TRUE),
  plotOutput("Plot1")
)
server <- function(input, output) {
  
  data <- reactive({
      if (is.null(input$Region)) {
        iris
      } else {
        iris %>% filter(Species %in% input$Region)   
      }
  })
  
  output$Plot1 <- renderPlot({
    data() %>%
      ggplot(aes(x=Species, Petal.Length)) +
        geom_bar(stat="identity", fill="steelblue")+
        theme_minimal()
  })
}
shinyApp(ui = ui, server = server)

Hi @ginberg.Thanks a ton for the reply.I wanted to know one more thing which i am trying to figure out and that is how do i display the bar plot with all the values from the region input either without selecting all the input values or having some kind of an 'all' value which if selected will display the plot for all the values of region.Is it possible.

Sure, that's possible. I have updated the example for the first case. For the second one, you would need to add an option to the selectInput and use that new option in the reactive so it returns the full dataset. I leave that open for you ok?:slight_smile:

This topic was automatically closed 21 days after the last reply. New replies are no longer allowed.

If you have a query related to it or one of the replies, start a new topic and refer back with a link.