I tried to recreate a map from C Sievert's great book on plotly & co (chapter 4.1.1).
Here the link.
library(plotly)
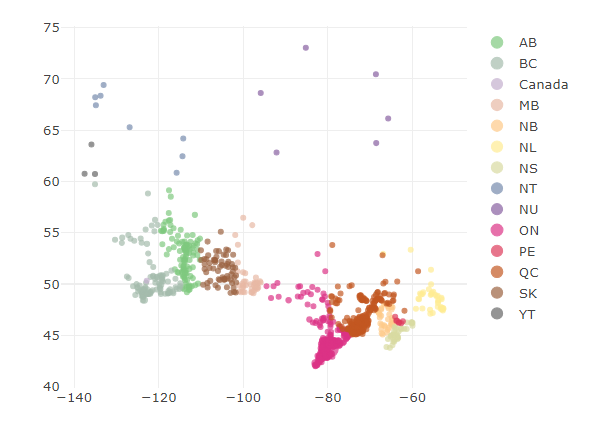
plot_mapbox(maps::canada.cities) %>%
add_markers(
x = ~long,
y = ~lat,
size = ~pop,
color = ~country.etc,
colors = "Accent",
text = ~paste(name, pop),
hoverinfo = "text"
)
The example runs as expected when using his RStudio Cloud version which loads plotly 4.9.0.9000.
If I update the package to the latest CRAN version (which I use on my machine, 4.9.2) the example doesn't work as intended. The result only shows the dots, but no map.
Any idea how to rectify this? Many thanks!
R