Hi, community
How could I let the legend in scatter plot to show the size group of point that I set, not by R automatically? Meanwhile, let the point in the legend become larger gradually? Any example data is welcome to show your idea.
Thank you for all the help.
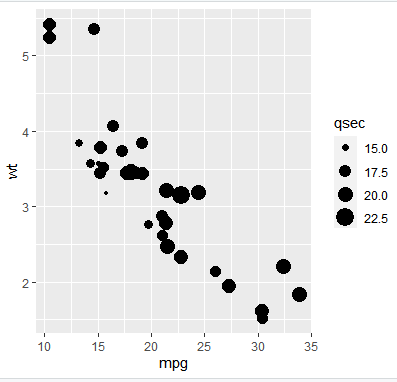
Do you mean something like this?
library(ggplot2)
ggplot(mtcars, aes(mpg, wt)) +
  geom_point(aes(size = qsec))
Otherwise, can you provide your own example and code?
1 Like
@williaml Thank you for your help. Yeah, it's what I want to express. What's more, how could we have more size group, not only 15, 17.5, 20.0, 22.5 in your plot? Maybe 15, 16, 17, 18, 19, 20, 21, 22, 23
library(ggplot2)
ggplot(mtcars, aes(mpg, wt)) +
  geom_point(aes(size = qsec)) +
  scale_size_continuous(breaks = 15:23)
1 Like
@nirgrahamuk Thank you. Though, it's not qesc that>=23, it's there method to add it in the plot legend? Just a not very normal thought.
I dont understand your question; is it that in the case of data that doesnt have information at that level, to still show the unused size regardless ?
One can also set the limits
ggplot(mtcars, aes(mpg, wt)) +
  geom_point(aes(size = qsec)) +
  scale_size_continuous(breaks = 15:23 ,
                        limits = c(15,23))
which causes the legend to include 23 despite no 23 in the data
1 Like
This topic was automatically closed 7 days after the last reply. New replies are no longer allowed.
If you have a query related to it or one of the replies, start a new topic and refer back with a link.