Hi there,
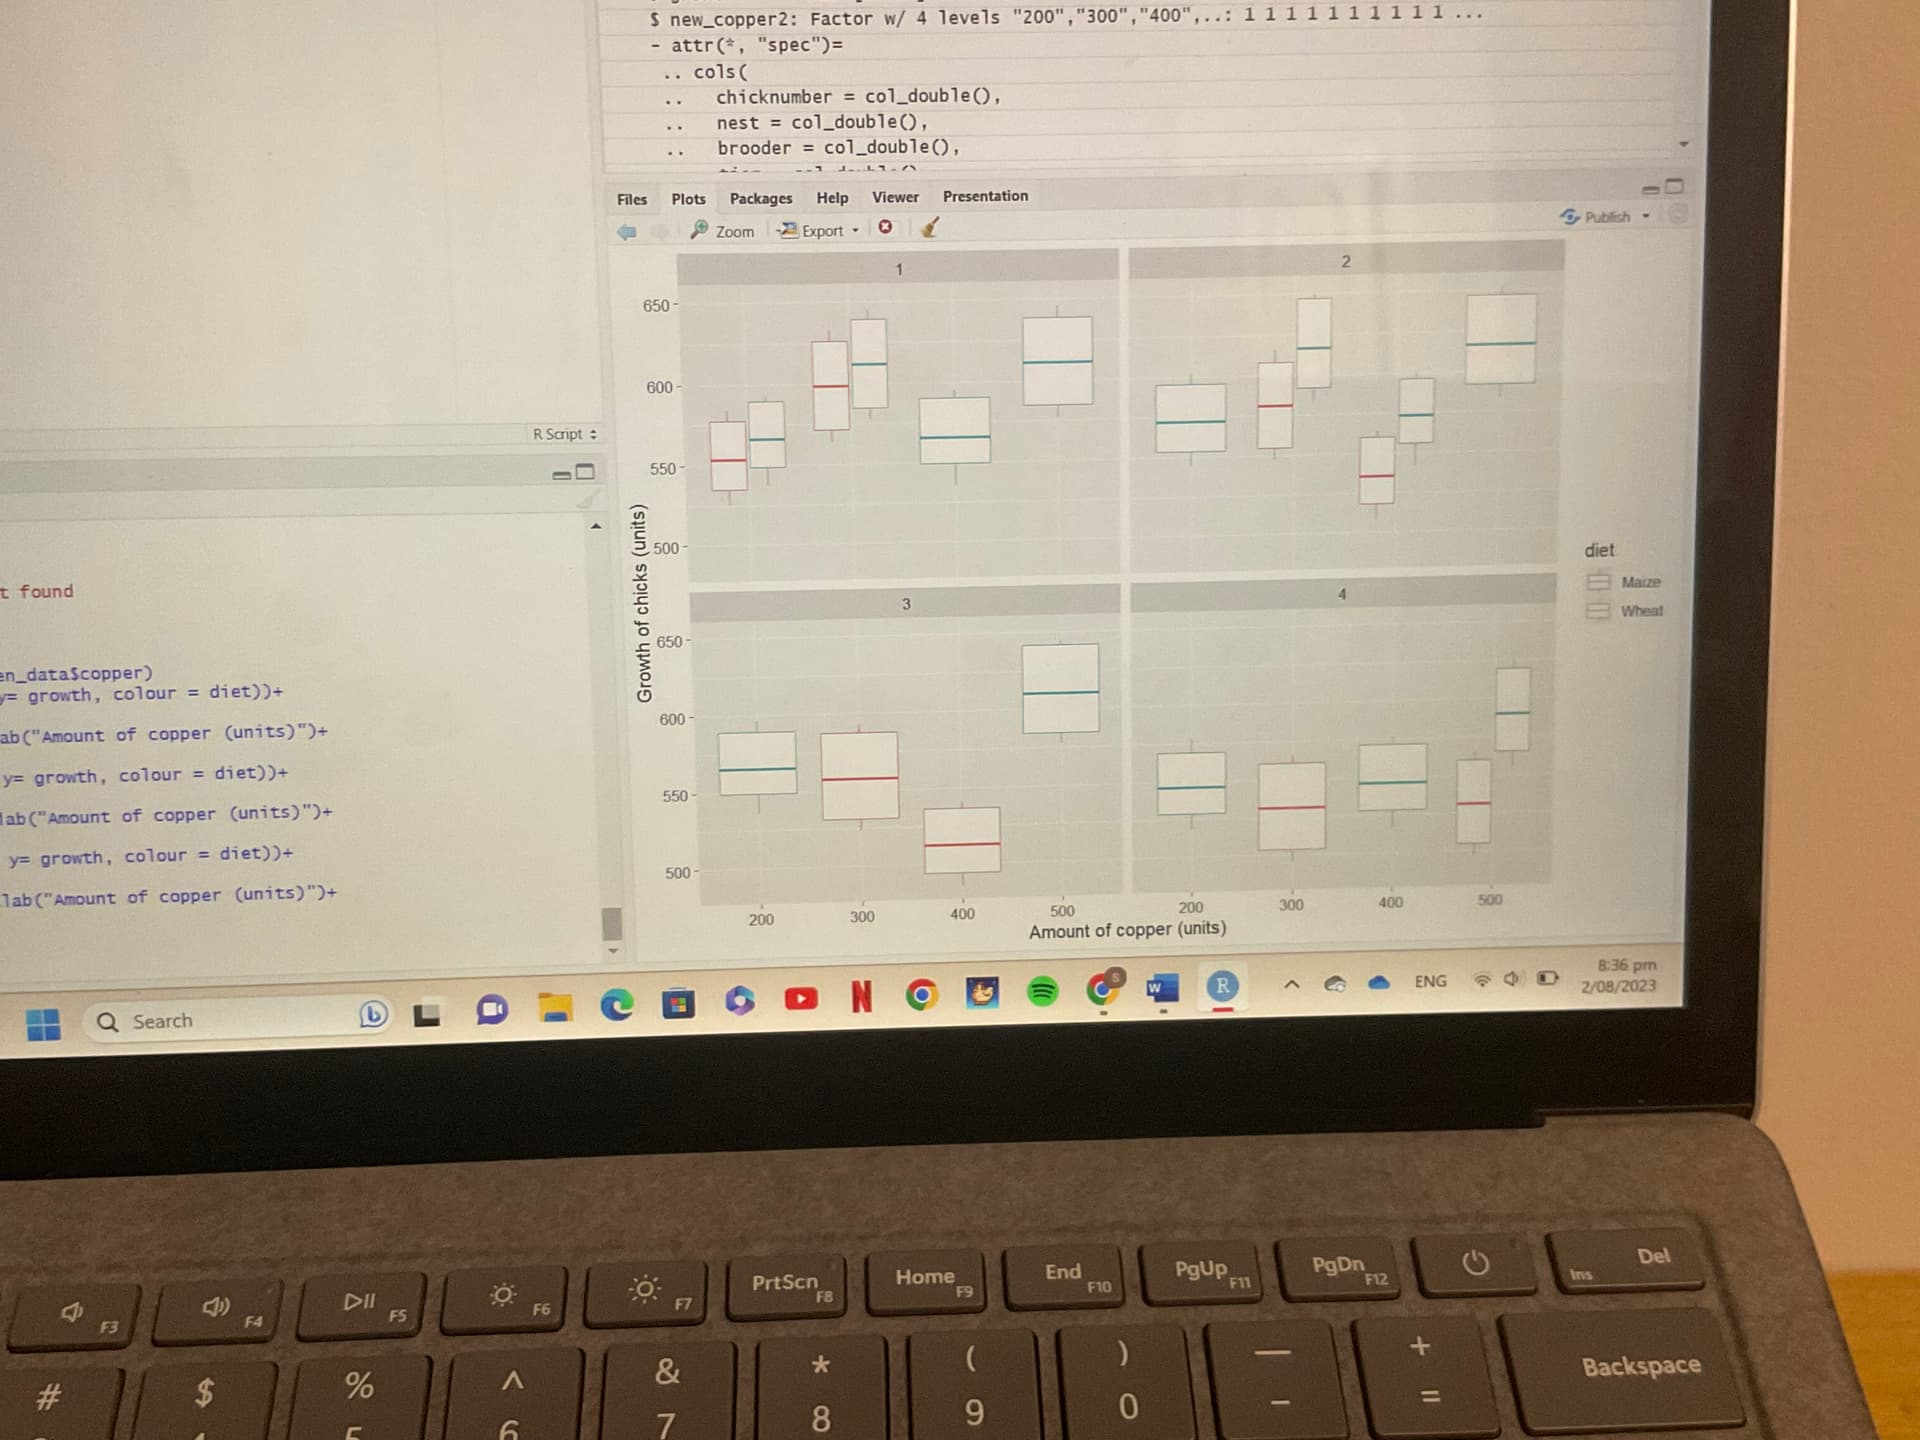
I’ve been learning to use a RCBD experiment design. So far I’ve made the plot but there are a lot of inconsistencies to it such as many points only having one box rather than two boxes for both maize and wheat diets. Not sure how to fix it.
I is very hard to say what is going on without seeing either code or data. Please make a subset of your data and post it here. I suggest you select the data where your faceting variable is 3 and your amount of copper is in the two bins marked 200 and 300. Give that subset the name DF and post the output of
dput(DF)
Please put a line with three back ticks before and after the output of dput, like this:
```
output of dput() goes here
```
Also show your ggplot() code.
This topic was automatically closed 21 days after the last reply. New replies are no longer allowed.
If you have a query related to it or one of the replies, start a new topic and refer back with a link.