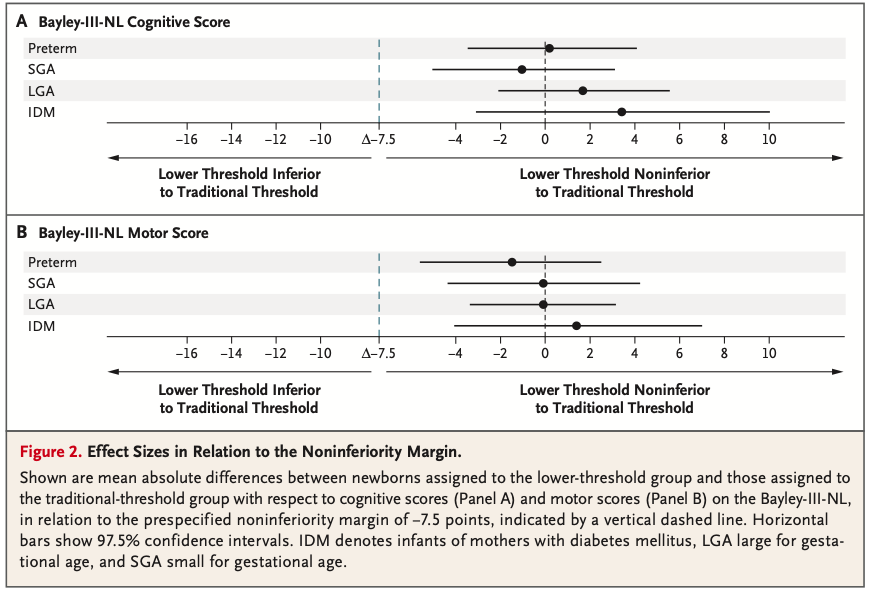
In a future state, I would like to make the standard multipanel plot seen in clinical research, with tags for figure panels A, B, etc., and a single text box figure legend for the figure at the bottom, as seen in a typical example here.
Ideally, one could make a multipanel plot with surrounding boxes and tags at top left (patchwork or cowplot or gridExtra), and a unifying figure legend in a text box with ggtext.
Any suggestions for this holy grail appreciated.