Hello,
I'm fairly new to R trying to learn to improve my research and analysis. I am currently having a problem plotting a simple plot.
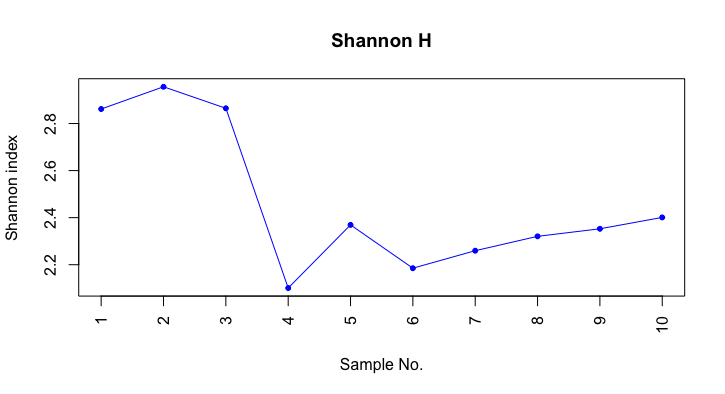
I have produced the following fairly simple plot, using the vegan package and the plot() function.
However, I have been trying to change two main things with no luck after some time Googling it:
(1) Change the x-axis labels from 1-10 to my sample names which are contained in row 0 (rownames) in my data frame.
(2) Rotate the plot, so sample numbers are along the y-axis and the diversity index is along the x-axis at the bottom.
I have used to following script:
Shannon <- diversity(ma.pollen.raw) # note that Shannon's is default

#Plot Diversity
plot(Shannon, main="Shannon H", ylab="Shannon index", xlab="Sample No.",
     type="o", pch=20, col="blue", xaxt="none")
axis(1, at=1:10, las=2)
If anyone knows how i could solve these issues it would be much appreciated.
Edit: here is the output. 53R 2W 30-32 etc are the sample numbers.
c(`53R 2W 30-32` = 2.86162969446256, `53R 5W 104-106` = 2.95617832691198,
`54R 3W 111-113` = 2.8647146296704, `55R 1W 71-73` = 2.10092197743549,
`55R 3W 54-56` = 2.36930698111516, `56R 2W 93-95` = 2.18519640960643,
`58R 1W 46-48` = 2.25954568296469, `60R 1W 20-22` = 2.32061901696518,
`62R 2W 28-30` = 2.35260879293557, `62R 6W 142-144` = 2.40107490601244
Thank,
Nick