You are trying to write the current plot image out to a png before there is an image. Try putting the png function after the plot().
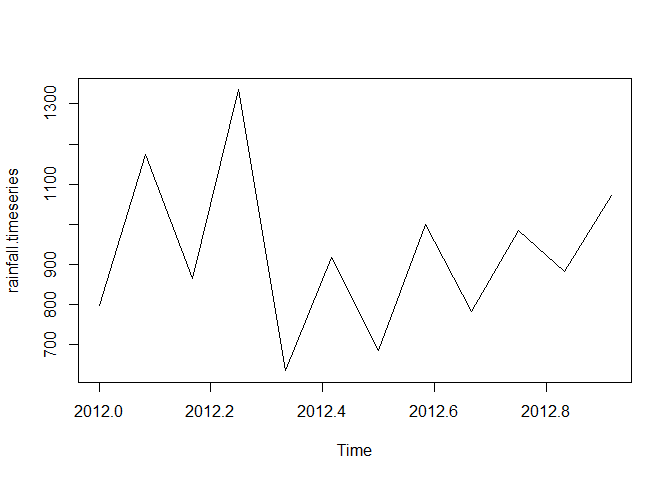
rainfall <- c(799,1174.8,865.1,1334.6,635.4,918.5,685.5,998.6,784.2,985,882.8,1071)

rainfall.timeseries <- ts(rainfall,start = c(2012,1),frequency = 12)

print(rainfall.timeseries)
#>         Jan    Feb    Mar    Apr    May    Jun    Jul    Aug    Sep    Oct
#> 2012  799.0 1174.8  865.1 1334.6  635.4  918.5  685.5  998.6  784.2  985.0
#>         Nov    Dec
#> 2012  882.8 1071.0

plot(rainfall.timeseries)