To help us help you, could you please prepare a reproducible example (reprex) illustrating your issue? Please have a look at this guide, to see how to create one:
This is also one of the errors I keep getting. I cannot understand my mistake. Could anybody please help?
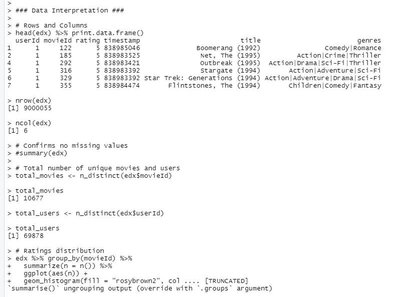
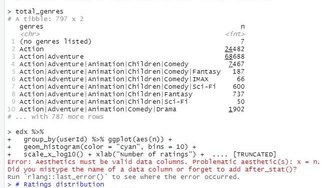
edx %>%
group_by(userId) %>% ggplot(aes(n)) +
geom_histogram(color = "cyan", bins = 10) +
scale_x_log10() + xlab("Number of ratings") + .... [TRUNCATED] Error: Aesthetics must be valid data columns. Problematic aesthetic(s): x = n. Did you mistype the name of a data column or forget to add after_stat()?
In your latest example, it seems that the edx data frame does not have a column named n. Did you leave out the summarize step by mistake?
Please post a reproducible example, as requested by andresrcs, if you need more help. It is difficult to help you if we cannot work with the same data set you are using. It is a good idea to make a simplified data set to illustrate your problem. Please see the link provided earlier.
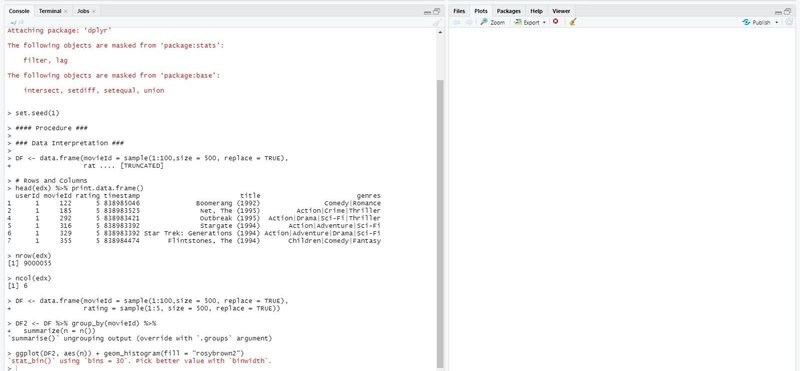
#This does not work because of the missing summarize()
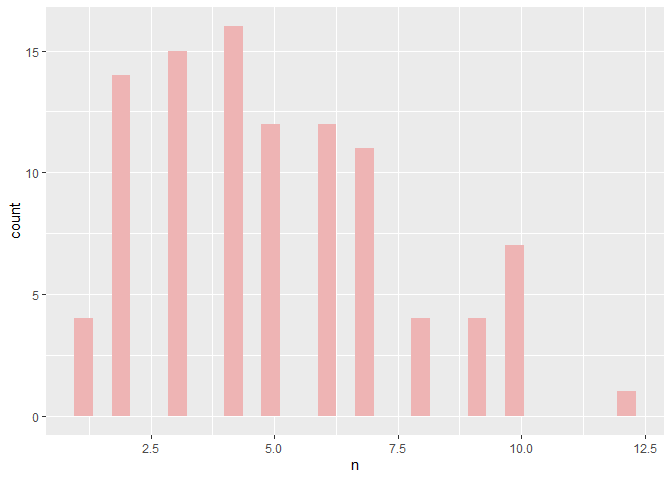
DF %>% group_by(movieId) %>%
ggplot(aes(n)) + geom_histogram(fill = "rosybrown2")
#> Don't know how to automatically pick scale for object of type function. Defaulting to continuous.
#> Error: Aesthetics must be valid data columns. Problematic aesthetic(s): x = n.
#> Did you mistype the name of a data column or forget to add after_stat()?
Should I do this for every plot further in the code?
The code did run but it's taking hours to form the plot. It's been 5 hours, the plot still hasn't formed.
My computer's speed is less.
Could you explain why you created DF instead of sticking to edx?
I created DF as a convenience because I do not have your data. You should substitute edx where I wrote
DF %>% group_by() %>%
This calculation should not take so much time. I believe you have 9 million rows, so the code could take a noticeable amount of time but nothing like five hours. I increased my data frame DF to 9 million rows and the calculation ran in about 1 second on my laptop that has 8 GB of memory.
The code runs but the plot section remains empty.
How do I increase the speed of the plot formation? It's been over half an hour now since I run the above code provided by you. The plot section is still empty.
should run very quickly. The data frame has 500 rows and the plotted data has 100 rows. Try breaking it up into three steps, run each step individually, and find which step is taking so long.
Does tmp have the number of rows you expect? You may get the error just running that part of the code. If so, I would suspect that each movieId appears more than once in avg_movie_rating and the left_join ends up making multiple versions of each row in edx. On the other hand, 52.9MB is not very large. Do you have a computer with little memory?