Hi. Thanks for the reccomendation . This is the tibble:
data = tibble::tribble(
~currency, ~time, ~difprev, ~difcst, ~n, ~init,
"AUD", "2021/02/01 00:00:00", 0.6, 0, 1L, 0,
"AUD", "2021/02/01 00:30:00", 0.442, 0, 2L, 0,
"AUD", "2021/02/01 05:30:00", -0.551, 0, 1L, 0,
"AUD", "2021/02/01 06:30:00", 0.03, 0, 1L, 0,
"AUD", "2021/02/02 01:30:00", 0, 0, 1L, 0,
"AUD", "2021/02/02 03:30:00", 0, 0, 2L, 0,
"AUD", "2021/02/02 21:30:00", -0.042, 0, 1L, 0,
"AUD", "2021/02/02 22:00:00", 0.025, 0, 1L, 0,
"AUD", "2021/02/03 00:30:00", -3.893, 0, 3L, 0,
"AUD", "2021/02/03 01:30:00", 0, 0, 1L, 0,
"AUD", "2021/02/04 00:30:00", 3.599, 0, 4L, 0,
"AUD", "2021/02/04 21:30:00", -0.026, 0, 1L, 0,
"AUD", "2021/02/04 22:30:00", 0, 0, 1L, 0,
"AUD", "2021/02/05 00:30:00", 0.639, -0.583, 3L, 0,
"AUD", "2021/02/05 20:30:00", 2.875, 0, 1L, 0,
"CAD", "2021/02/01 06:30:00", 0.042, 0, 1L, 0,
"CAD", "2021/02/01 14:30:00", 0.06, 0, 1L, 0,
"CAD", "2021/02/05 13:30:00", -127.898, 0.053, 8L, 0,
"CAD", "2021/02/05 15:00:00", -0.07, 0, 2L, 0,
"CAD", "2021/02/05 20:30:00", -0.167, 0, 1L, 0
)
head(data)
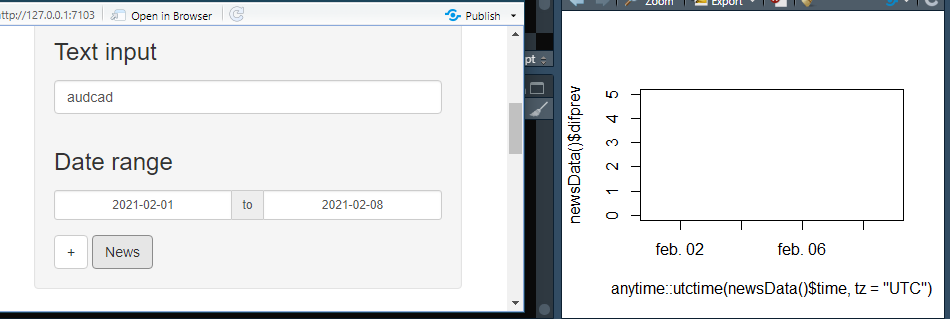
plot(anytime::utctime(data$time, tz="UTC"), data$difprev, type = "h")
But in Shiny the result didn't show me anything: