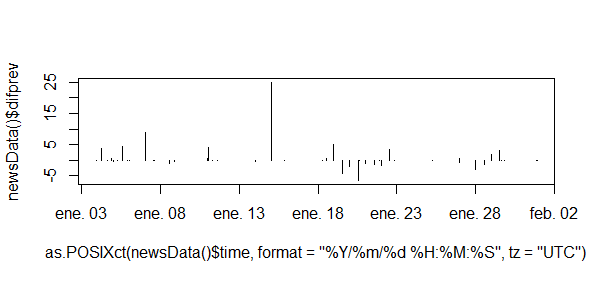
I have a weird error: the following plot works fine with a high range of DateTime (x) and with the last month (Ene - January). (The error didn't derive from any shiny function).
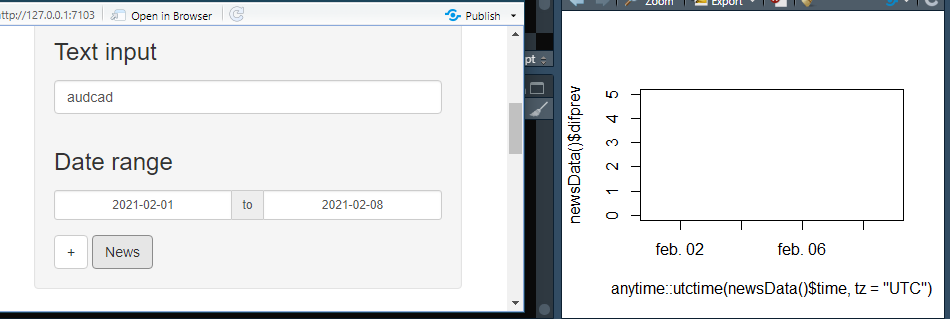
But, when I try to make a graph by mean of shiny app, with a lower range (A week Feb. 01 - Feb. 07), it doesn't show anything. There is not an error:
This is the code:
ui = fluidPage(navbarPage(
                   'TF Analytics',
                   tabPanel('Overview',
                            sidebarPanel(
                                textInput("text", label = h3("Text input"), value = "Enter text..."),
                                dateRangeInput("dates", label = h3("Date range")),
                                actionButton("action", label = "+")
                            ), mainPanel(
                                plotOutput(outputId = "plot")
                            )))
               ))

server = function(input, output) {

    newsData = function() {code to return a tibble}

    observeEvent(input$action,{
        p = plot(as.POSIXct(newsData()$time,format="%Y/%m/%d %H:%M:%S", tz="UTC"),
                          newsData()$difprev, type = "h")
        output$plot = renderPlot({
            p
        })
    })
}

shinyApp(ui = ui, server = server)
I used lubridate::as_datetime(), but it is the same.
What can I do? ![]()