Hi
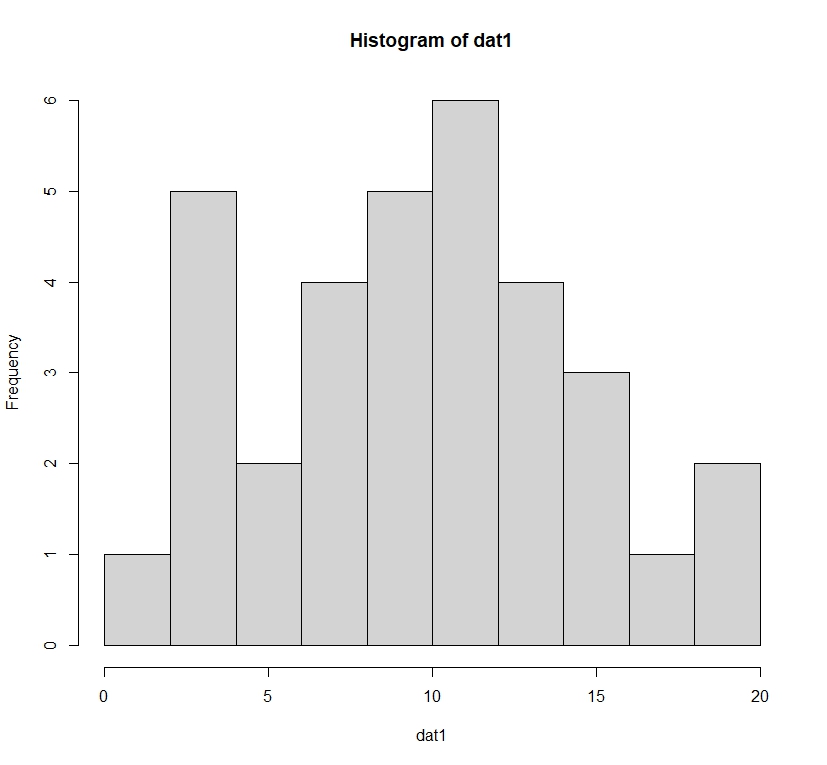
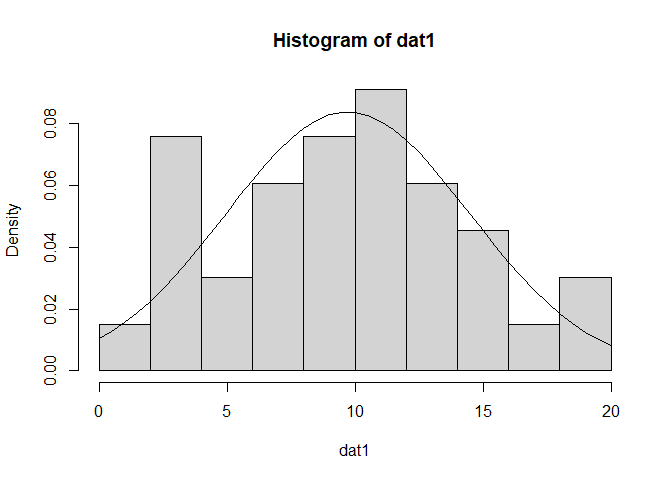
How to plot a histogram of the values in data and fit a normal density function in R at the same time. In this plot, hist and probability density curve. I can only do histograms now. Just take the dat1 as an example, thank you for your help in advance.
dat1<-c(9.1,10.7,10.2,14.9,7.4,13.8,9.3,10.6,1.3,2.8,5.8,8.9,9.4,7.3,12.5,18.4,15.0,11.8,13.7,10.2,9.5,7.6,13.6,3.6,3.2,10.2,17.7,6.8,3.5,18.9,15.5,4.9,2.6)
hist(dat1)
Created on 2022-11-01 with reprex v2.0.2