Hi RClub Folks,
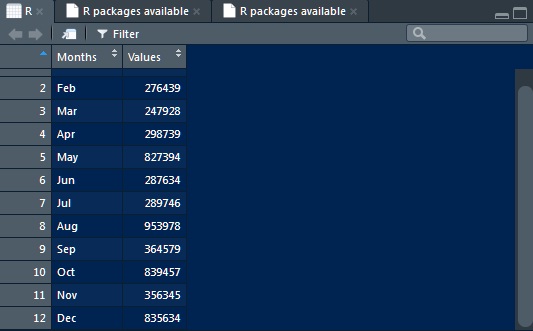
I have imported Excel Dataset contains Months and and Values, I wanna plot a Line Graphs using Columns and Rows, Can anyone share, initial codes and commands. thanks
First, you need put the example data, use dput() or repex-package.
If your data frame is dt put this. A basic example for you:
library(ggplot2)
ggplot(dt, aes(x=Months, y= Values, fill=Months)) +  # Use fill for color.
 geom_line()