Plot a data with two columns in shiny app based on selection

I am trying to create a shiny app that would plot the data based one column name to another one based on the two columns selected. This is my code but not sure where I am going wrong? Not sure if the select column is working correclty. Thanks

data1 <- tibble::tribble(
  ~power_draw_watt, ~gpu_temp_c, ~gpu_util_perc,
  131.55,         48L,            92L,
  117.03,         40L,            92L,
  121.64,         45L,            91L,
  50.23,         38L,            90L,
  141.82,         41L,            90L,
  120.5,         43L,            88L,
  121.09,         41L,            91L,
  27.18,         35L,             0L,
  139.63,         43L,            93L,
  77.87,         36L,            90L,
  88.47,         40L,            91L,
  125.88,         43L,            90L,
  42.44,         41L,             0L,
  96.04,         39L,            90L,
  94.27,         42L,            92L,
  146.32,         43L,            93L,
  93.58,         42L,            92L,
  125.01,         51L,            88L,
  71.59,         41L,            89L,
  96.88,         44L,            91L,
  41.38,         38L,             0L,
  129.4,         41L,            86L,
  102.62,         41L,            90L,
  124.08,         41L,            90L,
  155.11,         48L,            93L,
  42.48,         34L,             0L,
  141.29,         41L,            94L,
  143.55,         41L,            94L,
  89.96,         41L,            92L,
  28.67,         39L,             0L,
  39.42,         35L,             0L,
  115.72,         43L,            81L,
  74.24,         42L,            88L,
  121.99,         42L,            92L,
  89.05,         45L,            91L,
  95.33,         38L,            85L,
  119.93,         41L,            91L,
  123.62,         37L,            94L,
  42.21,         37L,             0L,
  102.21,         38L,            90L,
  113.52,         43L,            89L,
  97.03,         46L,            94L,
  137.69,         39L,            91L,
  36.27,         37L,             0L,
  37.23,         35L,             0L,
  136.58,         48L,            93L,
  103.83,         44L,            89L,
  51.29,         41L,             0L,
  47.64,         37L,             0L,
  89.85,         47L,            89L
)

library(shiny)

ui <- fluidPage(
  
  mainPanel(
    plotOutput("plot")
  ),

  selectInput(inputId ="data1",
              label = "choose data1",
              choices = names(data1),
              selected = NULL

),
selectInput(inputId ="data2",
            label = "choose data 2",
            choices = names(data1),
            selected = NULL
            
),
textOutput("result"))

server <- function(input,output){
  
  output$plot <- renderPlot({
    ggplot(data1,aes(x=data1$data1,y=data1$data2))+geom_point(colour='red')},height = 400,width = 600)
    
  } 

shinyApp(ui=ui,server=server)
1 Like

Have you tried to create the graphic outside of a shiny app ?
Is this working ? What does it look like ?

the idea is for us to know if you have a shiny related question, or a plot creation question. You tagged ggplo2 but there is no use for ggplot2 in your code.

Also,

to what are you refering with newplot and result ? There is no input with that ids.

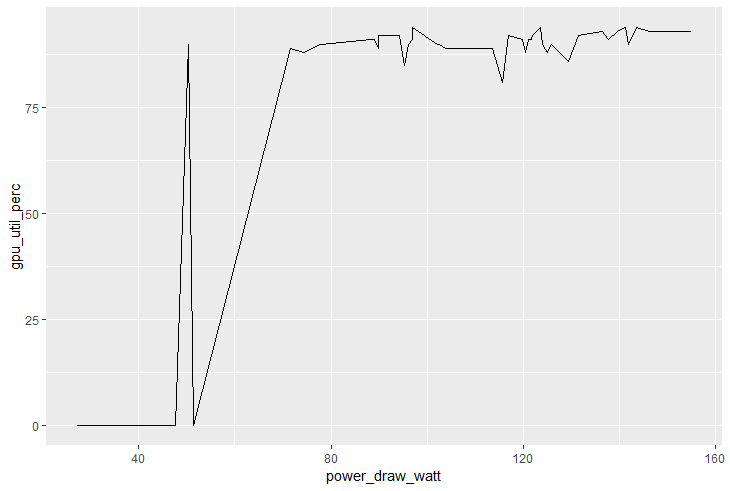
@cderv The graph works okay outside of shiny app.

The result stores the value of the drop-down menu and the plot for the plot's data.

ok so this is a ggplot2 graphic but I don't see the code for this plot in the shiny code you put in your question.
Do I miss something ? Did you try to put the code for this app into the shiny app ?

Currently, your selectInput are selecting value from the power_draw_watt column of the data.frame, and you are trying to plot input$result that does not exist. Are you sure about the shiny code ?
See Shiny debugging and reprex guide

As i am new to shiny app i was trying to just use plot, then i was going to build on it from there. I am not sure how to get the drop down menu to show the name of the column instead of the data to be able to select the variables to plot the data against. Thanks

you can provide the names of your table as choices (names(data1)) then use the selected name to filter the column you want.

For the plot, if you have one working, just try to identify the input that will be reactive to replace by shiny input.

If you are new to shiny app, I really recommend the shiny tutorial

Thanks for your help. I have updated my code for the Shiny App. However, I am now getting this error message:

Aesthetics must be either length 1 or the same as the data (50): x, y

Any idea where I am going wrong?

you need to replace by the input value. data1$data1 does not exist.

Be sure to read the first chapter of shiny tutorial to understand how shiny work and how reactive input are used in server.

Thanks I will take a look at chapter 1. Is the input value defined by inputid?

Yes. You can get the content of the input by calling input$<id>. In your case it will be names of column. You can't use that directly to build a graph, you need to select the data than build. One way to do it would be like that

server <- function(input,output){
  library(ggplot2)
  output$plot <- renderPlot({
    data <- data1[, c(input$data1, input$data2)]
    colnames(data) <- c("col1", "col2")
    ggplot(data,aes(x=col1,y=col2)) +
      geom_point(colour='red') +
      labs(x = input$data1, y = input$data2)
    }, height = 400, width = 600)

}

The other way using tidyverse and tidyeval would be

server <- function(input,output){
  library(dplyr)
  library(ggplot2)
  output$plot <- renderPlot({
    # transform the character name into symbol
    col1 <- sym(input$data1)
    col2 <- sym(input$data2)
    # use symbole unquoting with !!
    ggplot(data1, aes(x= !! col1, y= !! col2)) +
      geom_point(colour='red')
    }, height = 400, width = 600)

}

These two example should work.

2 Likes

@cderv Thanks very much for your hlep.

This topic was automatically closed 7 days after the last reply. New replies are no longer allowed.