Hello,
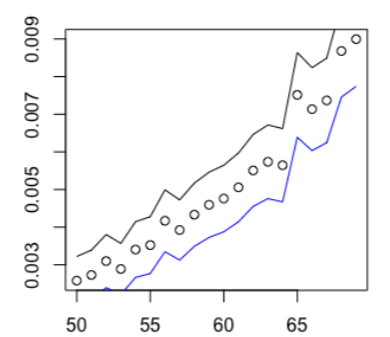
I would like to plot 2 vectors and one discrete variable in the same chart to obtain something similar to the print screen below :

As I'm new using R, I'll really appreciate if someone can tell me how to do this.
Thanks in advance
Hello,
I would like to plot 2 vectors and one discrete variable in the same chart to obtain something similar to the print screen below :

As I'm new using R, I'll really appreciate if someone can tell me how to do this.
Thanks in advance
I'd suggest looking into ggplot2
library(tidyverse)

# make up some data as none was provided
dat <- tibble(x = 1:20,
       y1 = 1:20,
       y2 = (1:20) + 5,
       y3 = (1:20) + 10) %>%
  mutate(across(y1:y3, jitter))

# plot
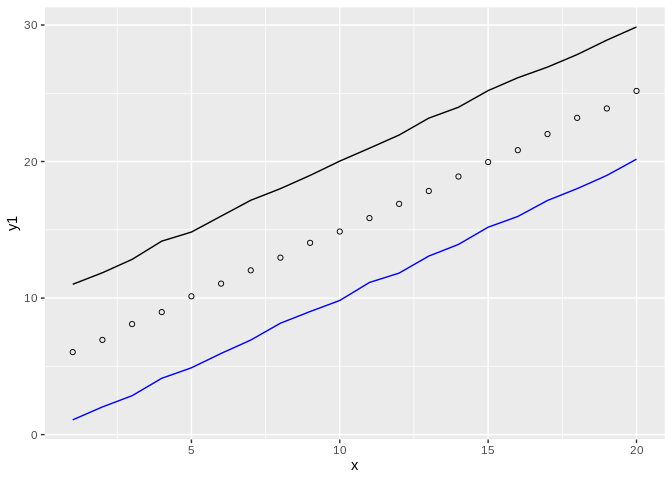
ggplot(dat, aes(x = x)) +
  geom_line(aes(y = y1), color = "blue") +
  geom_point(aes(y = y2), shape = 1) +
  geom_line(aes(y = y3), color = "black")

Created on 2022-04-12 by the reprex package (v2.0.1)
Thank you for your reply.
However, I'm still not able to obtain my plot. Therefore, I'm going to give a little more precision so that you can help me better. My data is composed of 3 vectors (I'm not sure if this is the exact nomenclature so I'm attaching a screen shot of one of them) each with 66 values. I would like to represent one of them by points and the other two by continuous lines. Finally, I have to represent only a part of these data but to do this I use xlim=c(x,y) and that shouldn't be a problem.
That is the type of values that I'm using for my plot
![]()
have your vectors be columns in a data.frame/tibble as per Jack's example.
You can construct such a thing by following Jacks example but replace 1:20 (the numbers one to 20 for x, with 1:66 ), replace the 1:20 defining y1 with your variable Mortality_male, etc.
You can dispense with the mutate(across... code as that was to make the example data appear non uniform, which your real data will naturally be.
I'm sorry to bother again but I tried to do what you said and it doesn't work yet. That's what I did and the errors it gives me.
1°/
dfICmale <- data.frame(IC_male) (and then the same for the other 2 vectors)
2°/
dat <- tibble(x = 1:66,
y1 = dfICmale5,
y2 = dfICmale,
y3 = dfICmale6 %>%)
ggplot(dat, aes(x = x)) +
geom_line(aes(y = y1), color = "blue") +
geom_point(aes(y = y2)) +
geom_line(aes(y = y3), color = "black")
It gives me 2 errors. The first one is
and the second one is :
Error in ggplot(dat, aes(x = x)) : object 'dat' not found
Let's read the error messages.
This means that R wasn't expecting a close parenthesis. This is because the pipe isn't doing anything. If you want to learn more about the pipe, read magrittr documentation:
https://cran.r-project.org/web/packages/magrittr/vignettes/magrittr.html
This means that "dat" doesn't exist in your global environment. This is because of the first error message.
The answer is to drop the pipe inside of your tibble().
Make sure you first load the "tidyverse" package before running the example provided by @JackDavison. Besides you can load separately the three packages used by @JackDavison, which are https://tibble.tidyverse.org/, https://dplyr.tidyverse.org/, and https://ggplot2.tidyverse.org/.
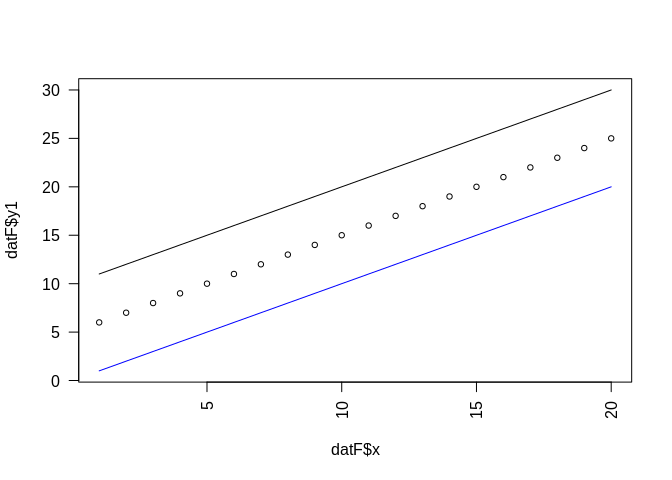
Below, I add plot(s) from base R
# Load the tidyverse library
library(tidyverse)
# make up some data as none was provided
dat <- tibble(x = 1:20,
y1 = 1:20,
y2 = (1:20) + 5,
y3 = (1:20) + 10) %>%
mutate(across(y1:y3, jitter))
# plot
ggplot(dat, aes(x = x)) +
  geom_line(aes(y = y1), color = "blue") +
  geom_point(aes(y = y2), shape = 1) +
  geom_line(aes(y = y3), color = "black")

# Using base R
datF <- data.frame( x = 1:20,
y1 = 1:20,
y2 = (1:20) + 5,
y3 = (1:20) + 10)
# Get the range for x-axis and y-axis
rangeX <- range(datF$x)
rangeY <- range( c(datF$y1, datF$y2, datF$y3) )
# Make the plot using using plot & points
plot(datF$x, datF$y1, type = "l", col = "blue",
xlim = c(rangeX[1], rangeX[2]),
ylim = c(rangeY[1], rangeY[2]), las = 2)
points(datF$x, datF$y2, type = "p", cex = 0.75)
points(datF$x, datF$y3, type = "l", col = "black")

# Make the plot using using plot & lines
rangeX <- range(datF$x)
rangeY <- range( c(datF$y1, datF$y2, datF$y3) )
# Make the plot
plot(datF$x, datF$y1, type = "l", col = "blue",
xlim = c(rangeX[1], rangeX[2]),
ylim = c(rangeY[1], rangeY[2]), las = 2)
lines(datF$x, datF$y2, type = "p", cex = 0.75)
lines(datF$x, datF$y3, type = "l", col = "black")

Thanks a lot for your help. I still have a last problem : I don't now how to scale the plot. Indeed by running the code below I have an error message saying "Don't know how to automatically pick scale for object of type data.frame. Defaulting to continuous.
Error in is.finite(x) : default method unavailable for type 'list'.
dat <- tibble(x = 1:66,
y1 = dfICMaletest5,
y2 = dfICmaletest,
y3 = dfICMaletest6)
     ggplot(dat, aes(x = x)) +
     geom_line(aes(y = y1), color = "blue") +
     geom_point(aes(y = y2)) +
     geom_line(aes(y = y3), color = "black")
So I tried with axis( 1 , ylim=c(0,0.2),col="black",col.axis="black",at=seq(60,65, by=1) but it doesn't work. Also, finally I don't know where to implement the xlim in order to get only the data I need for the 3 vectors.
the problem is you've put data.frames in your data.frame
dont do:
1°/
dfICmale <- data.frame(IC_male) (and then the same for the other 2 vectors)
2°/
dat <- tibble(x = 1:66,
y1 = dfICmale5,
rather do
1°/
dat <- tibble(x = 1:66,
y1 = IC_male,
y2 = whatever,
With regard to @nirgrahamuk , can you repost the codes with the new data you are using in a minimal reprex
reproducible manner?
This topic was automatically closed 21 days after the last reply. New replies are no longer allowed.
If you have a query related to it or one of the replies, start a new topic and refer back with a link.