So I have some final bug fixing for a specific part of my code that I am trying to figure out. I have attached an anonymized subset of the data I am working with so you can generate the problem yourselves. The data can be downloaded from this link:
I run the following code to create a retention mixed panel for my data. The task is to see how many donors to my company drop out of their monthly installment plans.
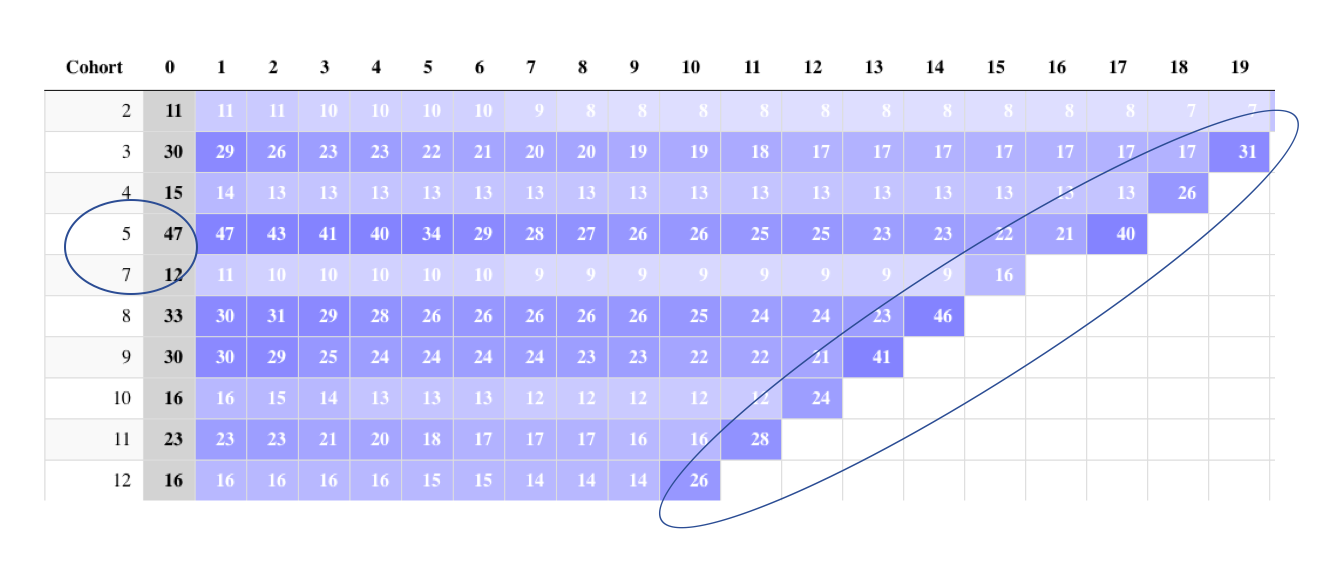
As you see in my final panel (see photo attached) there are two problems:
-
Cohort nr. 6 (I.e. customers signed up in the month of June) is missing from the count. I suspect the bug in this problem is under the section where I create the cohort.
-
At the end of each row the final number adds up. I can’t figure out why as it is measuring the dropout rate. How do I remove this final count in each row?
I really appreciate the help as these two bugs have been bothering me for days now.
Many Thanks,
Naja
My lines of code are:
#Question to rstudio community

#loading packages

library(foreign)
library(DT)
library(tidyverse)
library(reshape2)
library(ggplot2)
library(readxl)
library(stringr)
library(dplyr)
library(lubridate)
library(sqldf)

#loading data

donations2018 <- read_xlsx ("trial_sample2.xlsx")
###################################################
#Preprocessing dates
# Converting the Payment.date column into a date object
donations2018$Payment.date <- as.Date(donations2018$Payment.date, format = "%Y/%m/%d")

#Converting Start.date Column into a date object
donations2018$Start.date <- as.Date(donations2018$Start.date, format = "%Y/%m/%d")

# Setting up a column for the year data to make it easier to focus on specific year
donations2018$Year <- as.numeric(format(donations2018$Payment.date, '%Y'))

#Setting up a colum for only month
donations2018$Month <- as.numeric(format(donations2018$Payment.date, '%m'))


####################################################################################################
#Creating the cohorts

# Getting the purchase frequencies per Contact_number
order.frequency <- as.data.frame(table(donations2018$Contact_number))
colnames(order.frequency)[1] <- "Cust.Id"


# Getting the first transaction dates for each customer
join.date <- aggregate(Payment.date~Contact_number,donations2018,min, na.rm = TRUE)


# Changing the name of the column Payment.date to First_Payment
# since this is the first transaction date for each customer
colnames(join.date)[2] <- "First_Payment"

# Merge the Join date data to the donations2018 data frame
donations2018 <- merge(donations2018, join.date, by.x = "Contact_number",by.y = "Contact_number", all.x = TRUE)

# Merge the frequency data to the donations2018 data frame
donations2018 <- merge(donations2018, order.frequency, by.x = "Contact_number",by.y = "Cust.Id", all.x = TRUE)

# Creating the groups/Cohorts based on the join date month
donations2018$Cohort <- as.numeric(format(donations2018$First_Payment, "%m"))

rm(join.date)

####################################################################################################
#Cohort Age
# Calculating the difference in days between the Payment.date column by join date column
# There is no option for month, but getting the month from the days is simple division
donations2018$Age_by_Day <- as.numeric(difftime(donations2018$Payment.date,donations2018$First_Payment, units = c("days")))

#age by month
#Transform dates to date class
donations2018 = donations2018 %>% mutate(Payment.date= as.Date(Payment.date, format = "%Y-%m-%d"),
                                         First_Payment = as.Date(First_Payment, format = "%Y-%m-%d"))

#Calculate the difference in months
donations2018 = donations2018 %>% mutate(Age_by_Month = (year(Payment.date) - year(First_Payment))*12 +
                                           (month(Payment.date) - month(First_Payment)))

# Dumping the day element from the join date column
donations2018$First_Payment <- format(donations2018$First_Payment, "%Y-%m")

# Now we remove the day element from the Payment.date data since
# this Cohort Analysis is based on monthly activity.
donations2018$Payment.date <- format(donations2018$Payment.date, "%Y-%m")

# We relabel the cohort column data to something more intuitive for the sake
# of the report consumers, then factor them since these are sequential
groups <- c("Jan Cohorts",
            "Feb Cohorts",
            "Mar Cohorts",
            "Apr Cohorts",
            "May Cohorts",
            "Jun Cohorts",
            "Jul Cohorts",
            "Aug Cohorts",
            "Sep Cohorts",
            "Oct Cohorts",
            "Nov Cohorts",
            "Dec Cohorts")

for(i in 1:12){
  donations2018[donations2018$Cohort==i,"Cohort"] <- groups[i]
}
rm(i,groups)
donations2018

donations2018$Cohort <- factor(donations2018$Cohort,ordered = T,levels =c("Jan Cohorts",
                                                                          "Feb Cohorts",
                                                                          "Mar Cohorts",
                                                                          "Apr Cohorts",
                                                                          "May Cohorts",
                                                                          "Jun Cohorts",
                                                                          "Jul Cohorts",
                                                                          "Aug Cohorts",
                                                                          "Sep Cohorts",
                                                                          "Oct Cohorts",
                                                                          "Nov Cohorts",
                                                                          "Dec Cohorts"))


####################################################################################################
# Creating rows for each cohort group
#Creating columns for each value in the Age_by_Month column;0-11
# The default aggregation setup for dcast is, fun.aggregate = length
cohorts.wide <- reshape2::dcast(donations2018,Cohort~Age_by_Month,
                                value.var="Contact_number",
                                fun.aggregate = length)


#removing january variable:
#cohorts.wide <- cohorts.wide [-c(1),]

# Cloning the output for retention and churn mixpanels
# to be used later
cw.retention <- cohorts.wide
cw.churn <- cohorts.wide

#making cohorts numeric

cohorts.wide$Cohort <- as.numeric(cohorts.wide$Cohort)


#cohort 1 = January Cohort 12 = december

# Creating 19 breaks and 20 rgb color values ranging from blue to white
breaks <- quantile(cohorts.wide[,], probs = seq(.05, .95, .05), na.rm = TRUE)

colors <- sapply(round(seq(155, 80, length.out = length(breaks) + 1), 0),
                 function(x){ rgb(x,x,155, maxColorValue = 155) } )


# The Retention Mixpanel with counts
DT::datatable(cohorts.wide,
              class = 'cell-border stripe',
              rownames = FALSE,
              options = list(
                ordering=F,
                dom = 't',
                pageLength = 12) ) %>%
  formatStyle("0",
              backgroundColor = 'lightgrey',
              fontWeight = 'bold') %>%
  formatStyle(names(cohorts.wide[c(-1,-2)]),fontWeight = 'bold',color = 'white', backgroundColor = styleInterval(breaks,colors))

###############################################################################################