benj1
May 26, 2019, 9:45am
1
Hi,
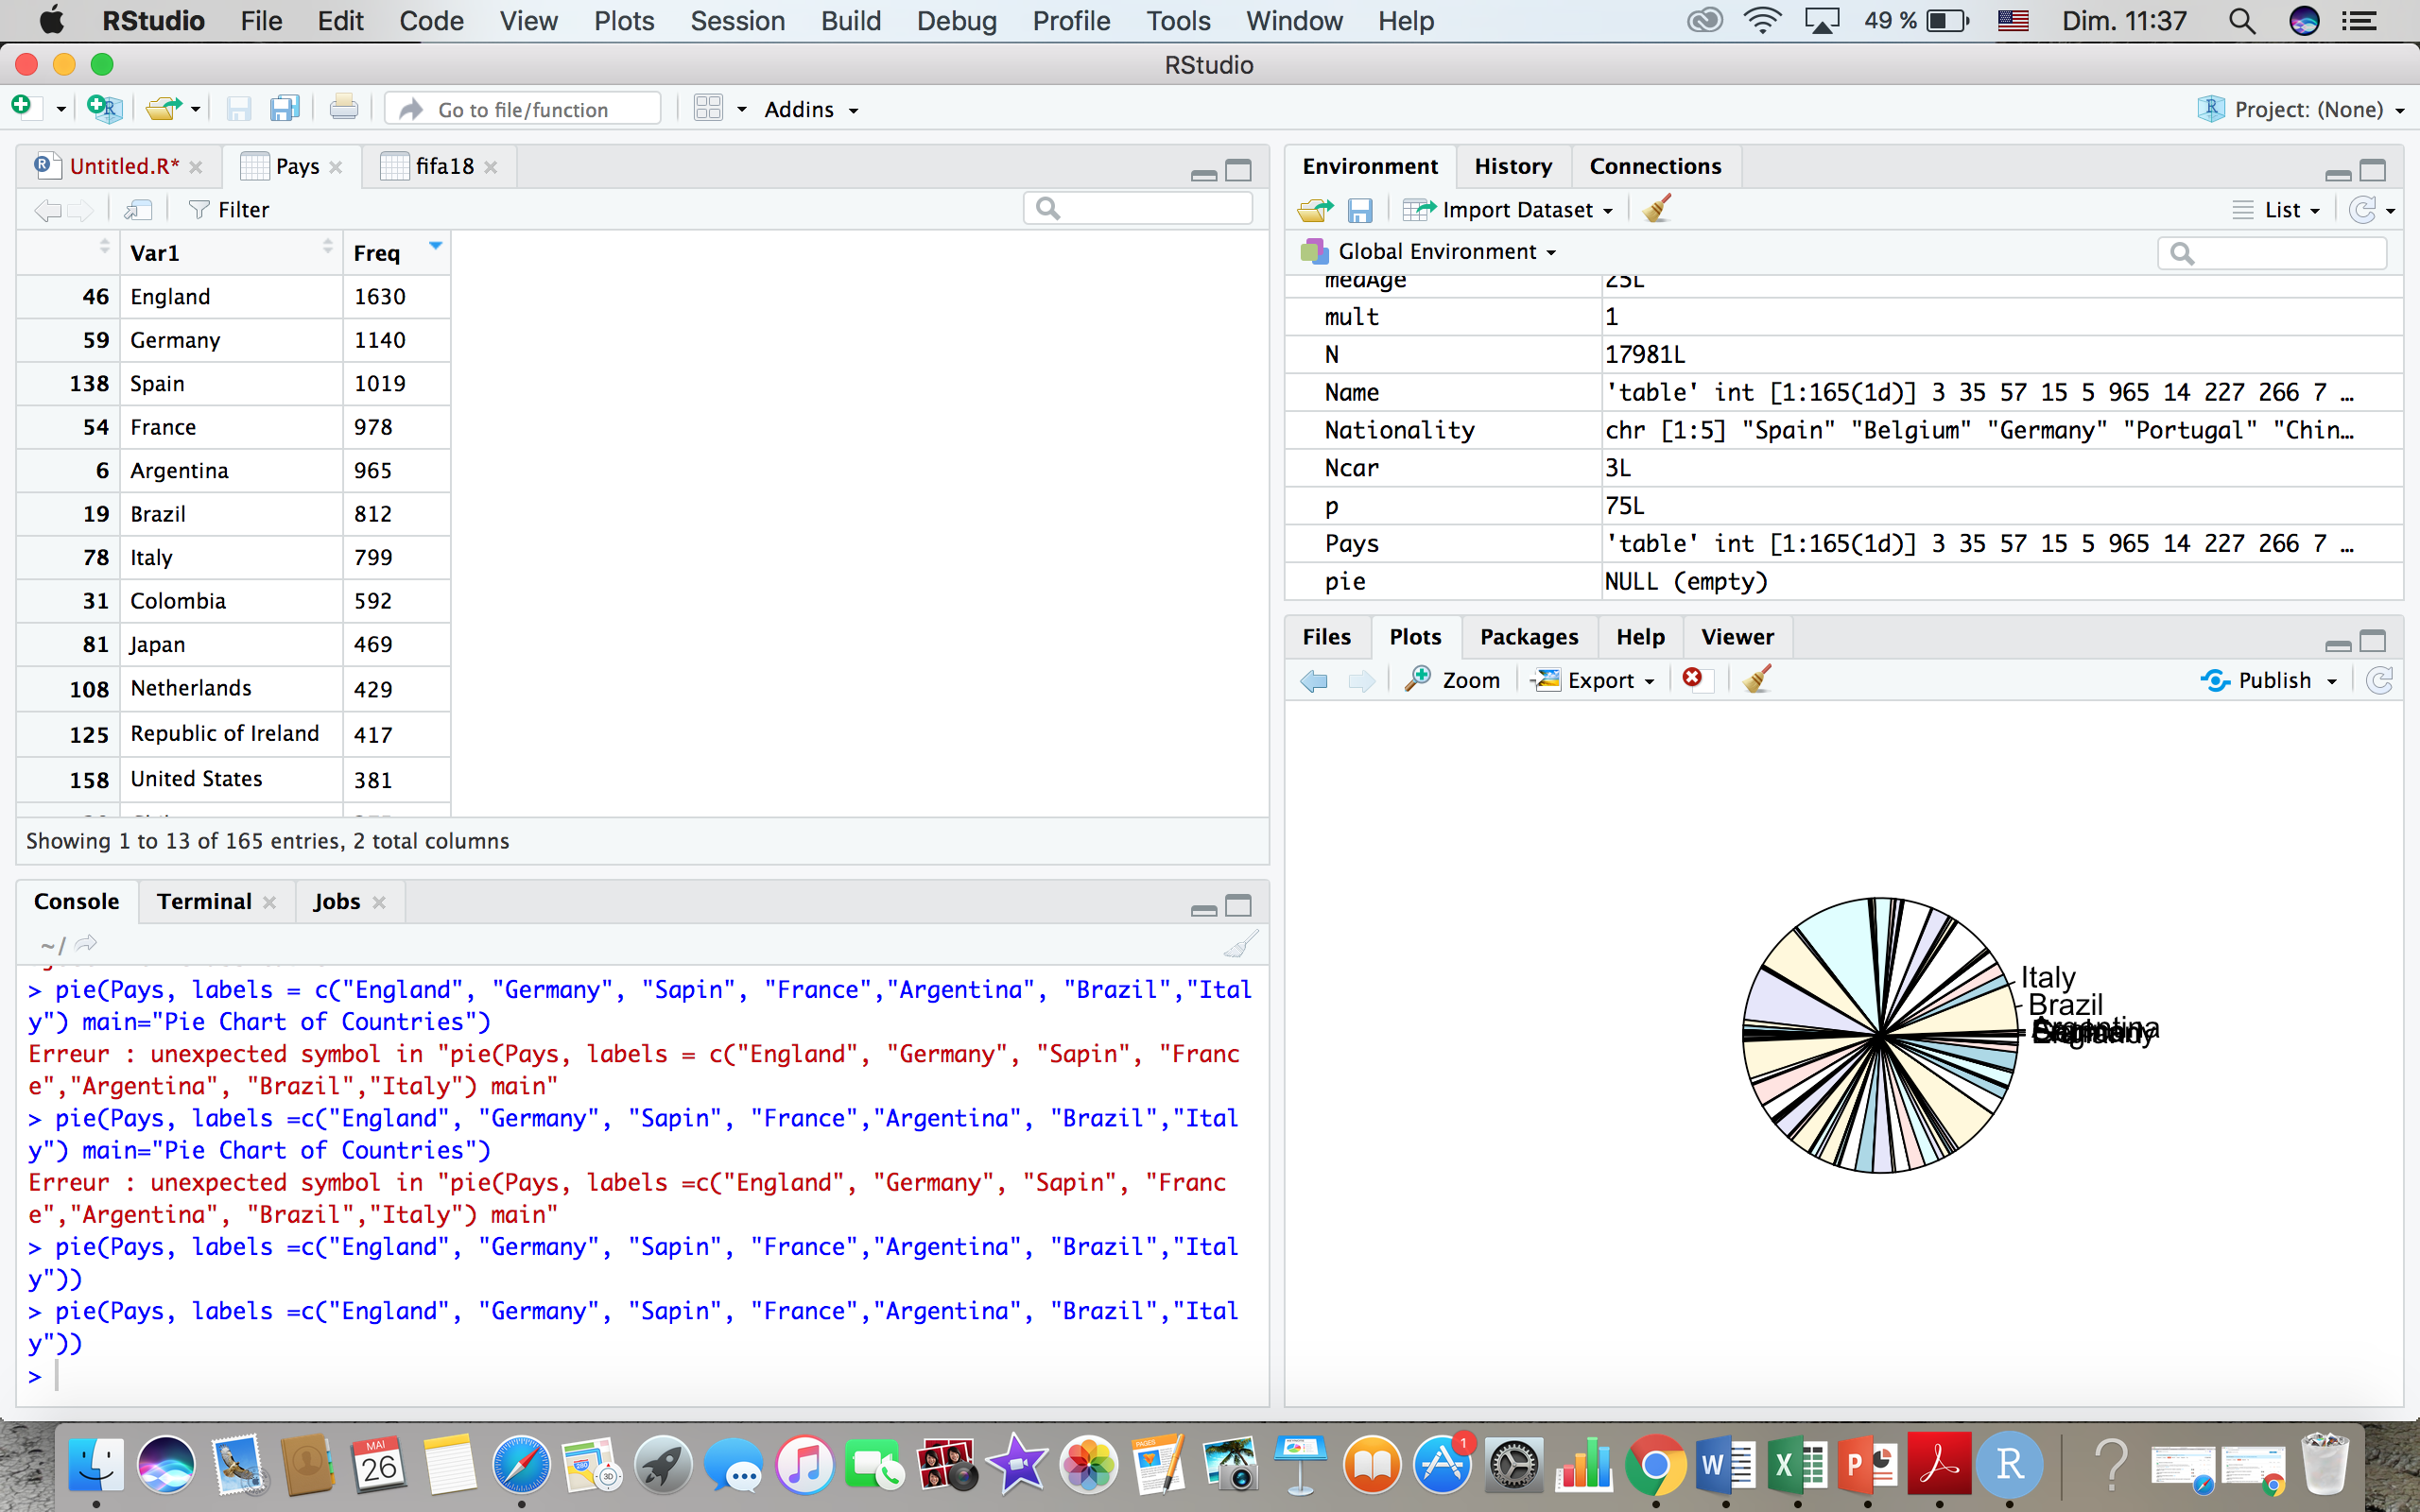
Here's my table with the variables
The think is that there is a lot of Country to put in my pie chart. What I want to do is to show the 12th first countries in my pie chart and put the others countries in a category named "Other" . If the pie chart is not comprehensive enough, then I will make a bar plot.
Thanks !
Screenshots are obstacles. For your future posts, please share your dataset (may be fake) and code in a copy-paste friendly way.
In case you don't know how to do it, there are many options, which include:
If you have stored the data set in some R object, dput function is very handy.
In case the data set is in a spreadsheet, check out the datapasta package. Take a look at this link .
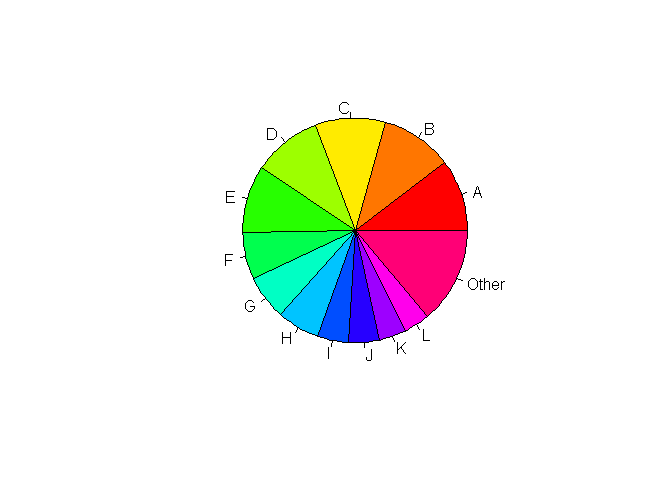
I created a dummy dataset with 20 countries. Then I combined the last 8 countries as "Other". I guess you're looking for something like this:
set.seed(seed = 31721)

Countries <- LETTERS[1:20]
Populations <- sort(x = sample(x = 100L:10000L,
                              size = 20,
                              replace = TRUE),
                    decreasing = TRUE)

Countries_mod <- c(Countries[1:12], "Other")
Populations_mod <- c(Populations[1:12], sum(Populations[13:length(x = Populations)]))

pie(x = Populations_mod,
    labels = Countries_mod,
    col = rainbow(n = 13))
Created on 2019-05-26 by the reprex package (v0.3.0)
Hope this helps.
system
June 2, 2019, 10:20am
3
This topic was automatically closed 7 days after the last reply. New replies are no longer allowed.