library(tidyverse)
#> Warning: package 'dplyr' was built under R version 3.5.1
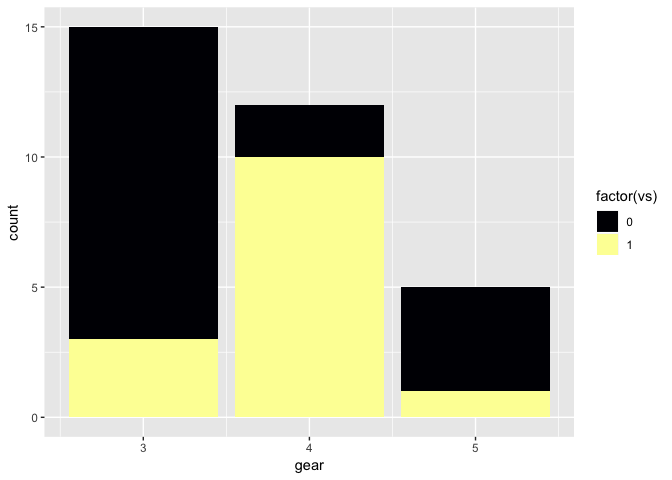
ggplot(mtcars, aes(gear, fill = factor(vs))) +
geom_bar() +
scale_fill_viridis_d(option = "B")
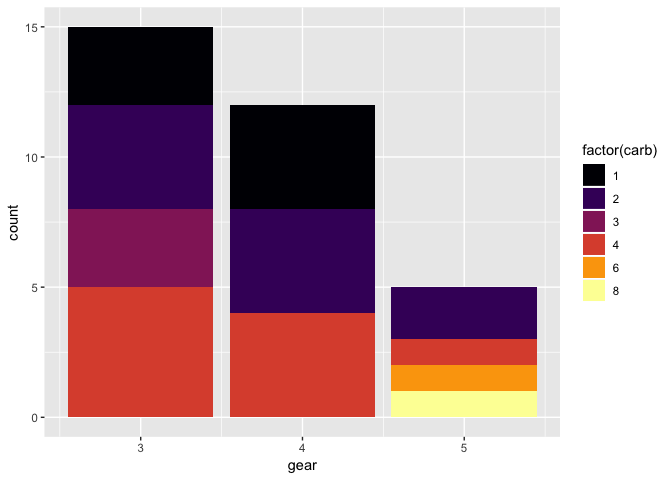
Is it possible to select what colors viridis uses for discrete scales? E.g. using the colors from carb 2 and 4 in the second plot for vs in the first plot.
Allow me to rephrase:) How do I select what colors viridis uses for discrete scales? I had a look in the documentation, but I still can't seem to wrap my head around all the options of scale.
Hiya @bragks! When you're using scale_*_viridis_d(), you can exert some limited control over the values it picks using the begin, end and direction arguments, which control the minimum and maximum values of the viridis range, as well as whether the values get progressively lighter or darker.
If you're looking for more specific control (ie. you want to pick out particular shades), I'd recommend retrieving them using viridis_pal and then passing the values on to scale_fill_manual using its values parameter (which take sa vector of colour names or hex values). Also, if you name the elements of values according to the values in your data, ggplot2 will match them up!