Permutation Variable Importance using AUC

Hi,

I have a MARS model where i am trying to run permutation tests based on auc for a binary classification problem.
I am using the iml package to try and achieve this. The iml package supports a range of loss functions and also allows you to define your own. AUC is not in the list of loss functions it supports but the package does allow you to create your own loss function based on the Metrics package (pg 5) which does have a function for auc. Quoting from the iml documentation on page 9

The loss function can be either specified via a string, or by handing a function to
FeatureImp(). If you want to use your own loss function it should have this signature: function(actual, predicted). Using the string is a shortcut to using loss functions from the Metrics package. Only use functions that return a single performance value, not a vector. Allowed losses are: "ce", "f1", "logLoss", "mae", "mse", "rmse", "mape", "mdae", "msle", "percent_bias", "rae", "rmse", "rmsle","rse", "rrse", "smape" See library(help = "Metrics") to get a list of functions.

I'm at a loss on how to implement it as there isn't an example in the documentation from what i can see. Can anyone help? Below is a minimal example based on the iris dataset

library(iml)
#> Warning: package 'iml' was built under R version 3.5.2
library(Metrics)
#> Warning: package 'Metrics' was built under R version 3.5.2
library(earth)
#> Loading required package: plotmo
#> Loading required package: plotrix
#> Loading required package: TeachingDemos
library(dplyr)
#> Warning: package 'dplyr' was built under R version 3.5.1
#> 
#> Attaching package: 'dplyr'
#> The following objects are masked from 'package:stats':
#> 
#>     filter, lag
#> The following objects are masked from 'package:base':
#> 
#>     intersect, setdiff, setequal, union

# Create a dataframe with a binary flag
mydf <- iris %>% 
  mutate(dep = ifelse(Species == 'setosa', 1, 0)) %>% 
  select(-Species)

# Run a Mars Model to try and predict the binary flag outcome
mod <- earth(form = dep~., data = mydf, glm=list(family=binomial, maxit = 100))
#> Warning: glm.fit: fitted probabilities numerically 0 or 1 occurred

# Setup for the iml package
X <- mydf %>% select(-dep)
y <- mydf %>% select(dep)
mymodel = Predictor$new(mod, data = X, y = y)

# This works
FeatureImp$new(mymodel,loss = 'mae', n.repetitions = 10, run = TRUE)
#> Interpretation method:  FeatureImp 
#> error function: mae
#> 
#> Analysed predictor: 
#> Prediction task: unknown 
#> 
#> 
#> Analysed data:
#> Sampling from data.frame with 150 rows and 4 columns.
#> 
#> Head of results:
#>        feature importance.05 importance importance.95 permutation.error
#> 1 Sepal.Length     1.0284097  1.0408661     1.1081485          36.52965
#> 2  Sepal.Width     0.9880988  0.9958539     1.0069320          34.94992
#> 3 Petal.Length     0.4852722  0.6511579     0.7196340          22.85267
#> 4  Petal.Width     0.4103780  0.6475188     0.7025534          22.72495

# I would like to get this to work
FeatureImp$new(mymodel,loss = 'auc', n.repetitions = 10, run = TRUE)
#> Error in withCallingHandlers({: Assertion on 'loss' failed: Must be element of set {'ce','f1','logLoss','mae','mse','rmse','mape','mdae','msle','percent_bias','rae','rmsle','rse','rrse','smape'}, but is 'auc'.
I haven't used iml yet, so I don't have a solution for that.

You can use the tidymodels packages to do this though and there is a pretty good selection of metrics in that package and it can be run in parallel over permutations using furrr

Here's some code and examples adapted from what you have:

library(tidymodels) # loads yardstick, purrr, and others
#> ── Attaching packages ────────────────────────────────────────────── tidymodels 0.0.2 ──
#> ✔ broom     0.5.1     ✔ purrr     0.2.5
#> ✔ dials     0.0.2     ✔ recipes   0.1.4
#> ✔ dplyr     0.7.8     ✔ rsample   0.0.3
#> ✔ ggplot2   3.1.0     ✔ tibble    1.4.2
#> ✔ infer     0.4.0     ✔ yardstick 0.0.2
#> ✔ parsnip   0.0.1
#> ── Conflicts ───────────────────────────────────────────────── tidymodels_conflicts() ──
#> ✖ purrr::discard() masks scales::discard()
#> ✖ rsample::fill()  masks tidyr::fill()
#> ✖ dplyr::filter()  masks stats::filter()
#> ✖ dplyr::lag()     masks stats::lag()
#> ✖ recipes::step()  masks stats::step()
library(furrr)  # optional for parallel processing
#> Loading required package: future

# some functions ---------------------------------------------------------------

# `x` is a predictor, `y` is an outcome
# `metrics` is a function for estimating performance. See yardstick::metric_set
# `iter` can be ignored
estimates <- function(iter, x, y, metrics, permute = TRUE) {
  if (permute)
    x <- sample(x)
  res <-
    tibble(x = x, y = y) %>%
    metrics(y, x) %>%
    mutate(.estimator = if(permute) "permuted" else "real")
  res
}

# This computes the permuted (or original) values for each variable and metric
perm_dist <- function(x, y, metrics, times = 1000, ...) {
  permuted <- purrr::map_dfr(1:times, estimates, x = x, y = y, metrics = metrics, ...)
  # or, for parallel:
  # permuted <- furrr::future_map_dfr(1:times, perm_estimate, x = x, y = y, metrics = metrics)
  permuted
}

# example ----------------------------------------------------------------------

mydf <- iris %>% 
  mutate(
    # Changed this to a factor representation
    dep = ifelse(Species == 'setosa', "setosa", "other"),
    dep = factor(dep, levels = c("setosa", "other"))
  ) %>% 
  select(-Species)

X <- mydf %>% select(-dep)
y <- mydf %>% select(dep)

# Show the results for more than one metric. I'll using areas under the ROC
# and PR curves as examples
auc_metrics <- metric_set(roc_auc, pr_auc)

# Example for one variable
perm_dist(X$Sepal.Length, y$dep, auc_metrics, times = 3)
#> # A tibble: 6 x 3
#>   .metric .estimator .estimate
#>   <chr>   <chr>          <dbl>
#> 1 roc_auc permuted       0.556
#> 2 pr_auc  permuted       0.870
#> 3 roc_auc permuted       0.564
#> 4 pr_auc  permuted       0.761
#> 5 roc_auc permuted       0.532
#> 6 pr_auc  permuted       0.803

# Do for all variables
set.seed(362)
perm_estimates <-
  purrr::map_dfr(X,
                 perm_dist,
                 y = y$dep,
                 metrics = auc_metrics,
                 .id = "variable")

# Now get the real values
real_estimates <-
  purrr::map_dfr(
    X,
    perm_dist,
    y = y$dep,
    metrics = auc_metrics,
    .id = "variable",
    times = 1,
    permute = FALSE
  )

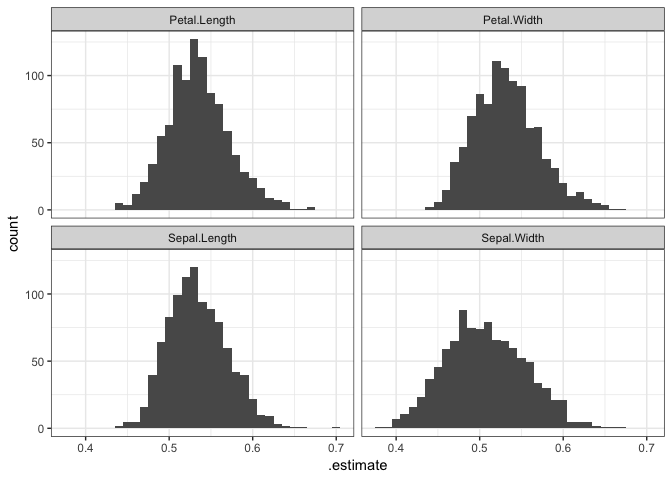
# What does their distribution look like? 
perm_estimates %>% 
  dplyr::filter(.metric == "roc_auc") %>% 
  ggplot(aes(x = .estimate)) + 
  geom_histogram(binwidth = .01) + 
  facet_wrap(~variable) + 
  theme_bw()


# I usually compute a t-like statistic using the mean and sd of the 
# permutation distribution
perm_estimates %>% 
  group_by(variable, .metric) %>% 
  summarize(mean = mean(.estimate), sd = sd(.estimate)) %>% 
  full_join(real_estimates, by = c("variable", ".metric")) %>% 
  mutate(score = abs(.estimate - mean)/sd) %>% 
  dplyr::select(variable, .metric, score) %>% 
  spread(.metric, score)
#> # A tibble: 4 x 3
#> # Groups:   variable [4]
#>   variable     pr_auc roc_auc
#>   <chr>         <dbl>   <dbl>
#> 1 Petal.Length   9.10   12.6 
#> 2 Petal.Width   10.9    12.0 
#> 3 Sepal.Length   8.48   12.0 
#> 4 Sepal.Width    2.19    7.65

Created on 2018-12-29 by the reprex package (v0.2.1)

And I forgot to mention that you should also look at the importance score that comes with earth:

> earth::evimp(mod)
             nsubsets   gcv    rss
Petal.Length        3 100.0  100.0
Petal.Width         2   5.5    5.9
Sepal.Length        1   3.6    3.8

Hi @Max

Thank you for answering my question.
If i follow the code correctly the function estimates takes each column and permutates it by sampling randomly from the column. The ROC_AUC is then calculated. I was wondering if you would have time for two quick follow up questions

If my understanding of permutation tests is correct, the aim is basically to shuffle the independent variables breaking their links with the dependent variable and then measuring the AUC drop. Shouldn't we execute the MARS function within the estimates function in the code or have I gotten completely mixed up?

The second question is in relation to the t-like statistic you mentioned. From looking at the code it looks like you just subtract the mean from the value and scale it over its standard deviation. I guess the results can be read by sorting the score from highest to lowest?

Again thank you very much for your time

Sort of. If you are measuring predictors outside of the model (that's what my code does), then there is no sense of a "drop", just how rare the observed effect is.

For a model-related permutation approach, you need a holdout sample that is not being used to fit the model. Random forests do this naturally since each tree is based on a bootstrap sample. Many models, including MARS, do not use any resampling when fitting the model so there is no internal method for doing so.

However, we can do something similar. Here's an example that doesn't use permutations but fits a full model and compares the drop in performance against a model without each predictor.

If you want something analogous to what random forests does, there is code below. It's fairly heavy on the parsnip, rsample, and recipes packages but it's a good example to work through.

Yes. It standardizes the results and sorting from high to low would help identify the best predictors.

Here's some code:

library(tidymodels)
#> ── Attaching packages ────────────────────────────────────────────── tidymodels 0.0.2 ──
#> ✔ broom     0.5.1     ✔ purrr     0.2.5
#> ✔ dials     0.0.2     ✔ recipes   0.1.4
#> ✔ dplyr     0.7.8     ✔ rsample   0.0.3
#> ✔ ggplot2   3.1.0     ✔ tibble    1.4.2
#> ✔ infer     0.4.0     ✔ yardstick 0.0.2
#> ✔ parsnip   0.0.1
#> ── Conflicts ───────────────────────────────────────────────── tidymodels_conflicts() ──
#> ✖ purrr::discard() masks scales::discard()
#> ✖ rsample::fill()  masks tidyr::fill()
#> ✖ dplyr::filter()  masks stats::filter()
#> ✖ dplyr::lag()     masks stats::lag()
#> ✖ recipes::step()  masks stats::step()

# Some more functions ----------------------------------------------------------

# For a specific resample, fit the model to the in-sample
# data and return the fitted object
get_model <- function(split, ...) {
  # Setup the MARS model using the parsnip package
  mars_mod <-
    mars(mode = "classification") %>%
    set_engine("earth", glm = list(family = binomial, maxit = 100))

  # Fit using the bootstrap sample
  model_fit <-
    fit_xy(
      mars_mod,
      x = analysis(split) %>%  dplyr::select(-dep),
      y = analysis(split) %>%  dplyr::select(dep) %>% pull(1)
    )
  model_fit
}

# Get predictors for the data held out from the model fit (aka the "out-of-bag"
# data. Optionally, shuffle any predictor whose name is given to the
# `permute` argument. Otherwise do things as normal.
# This returns the metrics that are requested.
metric_per_resample <- function(split, model, metrics, permute = NA) {
  rec <- recipe(dep ~ ., data = assessment(split))
  if (!is.na(permute)) {
    rec <- rec %>% step_shuffle(!!permute)
    est <- permute
  } else est <- "original"
  rec <- prep(rec, training = analysis(split), fresh = TRUE)
  holdout_data <- bake(rec, new_data = assessment(split))

  # Compute performance
  predict(model, new_data = holdout_data, type = "prob") %>%
    bind_cols(holdout_data %>% dplyr::select(dep)) %>%
    metrics(truth = dep, .pred_setosa) %>%
    # spread(.metric, .estimate) %>%
    mutate(
      .estimator = est,
      .resample = labels(split) %>% pull(id)
    )
}

# Do the same as `metric_per_resample` but reorder the argument names to make
# it easier to map over.
by_variable <- function(variable, split, model, metrics) {
  metric_per_resample(split, model, metrics, variable)
}


# For each resample and model, get the original and permuted estimates of
# performance.
get_metrics <- function(split, model, metrics) {
  # Get predictor names
  predictors <- assessment(split) %>% dplyr::select(-dep) %>% names()

  # performance without permuting
  original <-
    metric_per_resample(split, model, metrics) %>%
    dplyr::select(-.estimator) %>%
    dplyr::rename(.original = .estimate)

  # merge both sets of estimates together
  map_dfr(predictors, by_variable, split, model, metrics) %>%
    full_join(original, by = c(".metric", ".resample"))
}

# Do the computations ----------------------------------------------------------


mydf <- iris %>%
  mutate(
    # Changed this to a factor representation
    dep = ifelse(Species == 'setosa', "setosa", "other"),
    dep = factor(dep, levels = c("setosa", "other"))
  ) %>%
  dplyr::select(-Species)

# Show the results for more than one metric. I'll using areas under the ROC
# and PR curves as examples
auc_metrics <- metric_set(roc_auc, pr_auc)

# This may take a while:
set.seed(452)
boot_samples <-
  bootstraps(mydf, times = 50) %>%
  mutate(
    models = map(splits, get_model),
    metric_values = map2(splits, models, get_metrics, metrics = auc_metrics)
  )
#> Warning: glm.fit: fitted probabilities numerically 0 or 1 occurred

<snip>

# Compute the performance loss then take averages
boot_samples %>%
  pull(metric_values) %>%
  bind_rows() %>%
  mutate(drop = .original - .estimate) %>%
  group_by(.metric, .estimator) %>%
  summarize(mean_drop = mean(drop)) %>%
  spread(.metric, mean_drop)
#> # A tibble: 4 x 3
#>   .estimator       pr_auc roc_auc
#>   <chr>             <dbl>   <dbl>
#> 1 Petal.Length  0.335      0.271 
#> 2 Petal.Width   0.0751     0.0444
#> 3 Sepal.Length  0.0000368  0     
#> 4 Sepal.Width  -0.000452   0

Created on 2018-12-30 by the reprex package (v0.2.1)

Note that the zeros occur when MARS doesn't use the predictor in the model at all.

2 Likes

Hi @Max

Thanks very much for supply the code in your last answer
I had the chance to go through it yesterday and it def gives me a much better understanding of whats going on

I hope you are well. Thanks again

A post was split to a new topic: error: Error in auc3_(actual, predicted, ranks) : Not compatible with requested type: [type=character; target=double].

This topic was automatically closed 7 days after the last reply. New replies are no longer allowed.