Hello,
I am using the library "cowplot" to use function plot_grid()
plots = plot_grid(plot1,plot2,plot3, align = "v", ncol=1, vjust = -0.8)
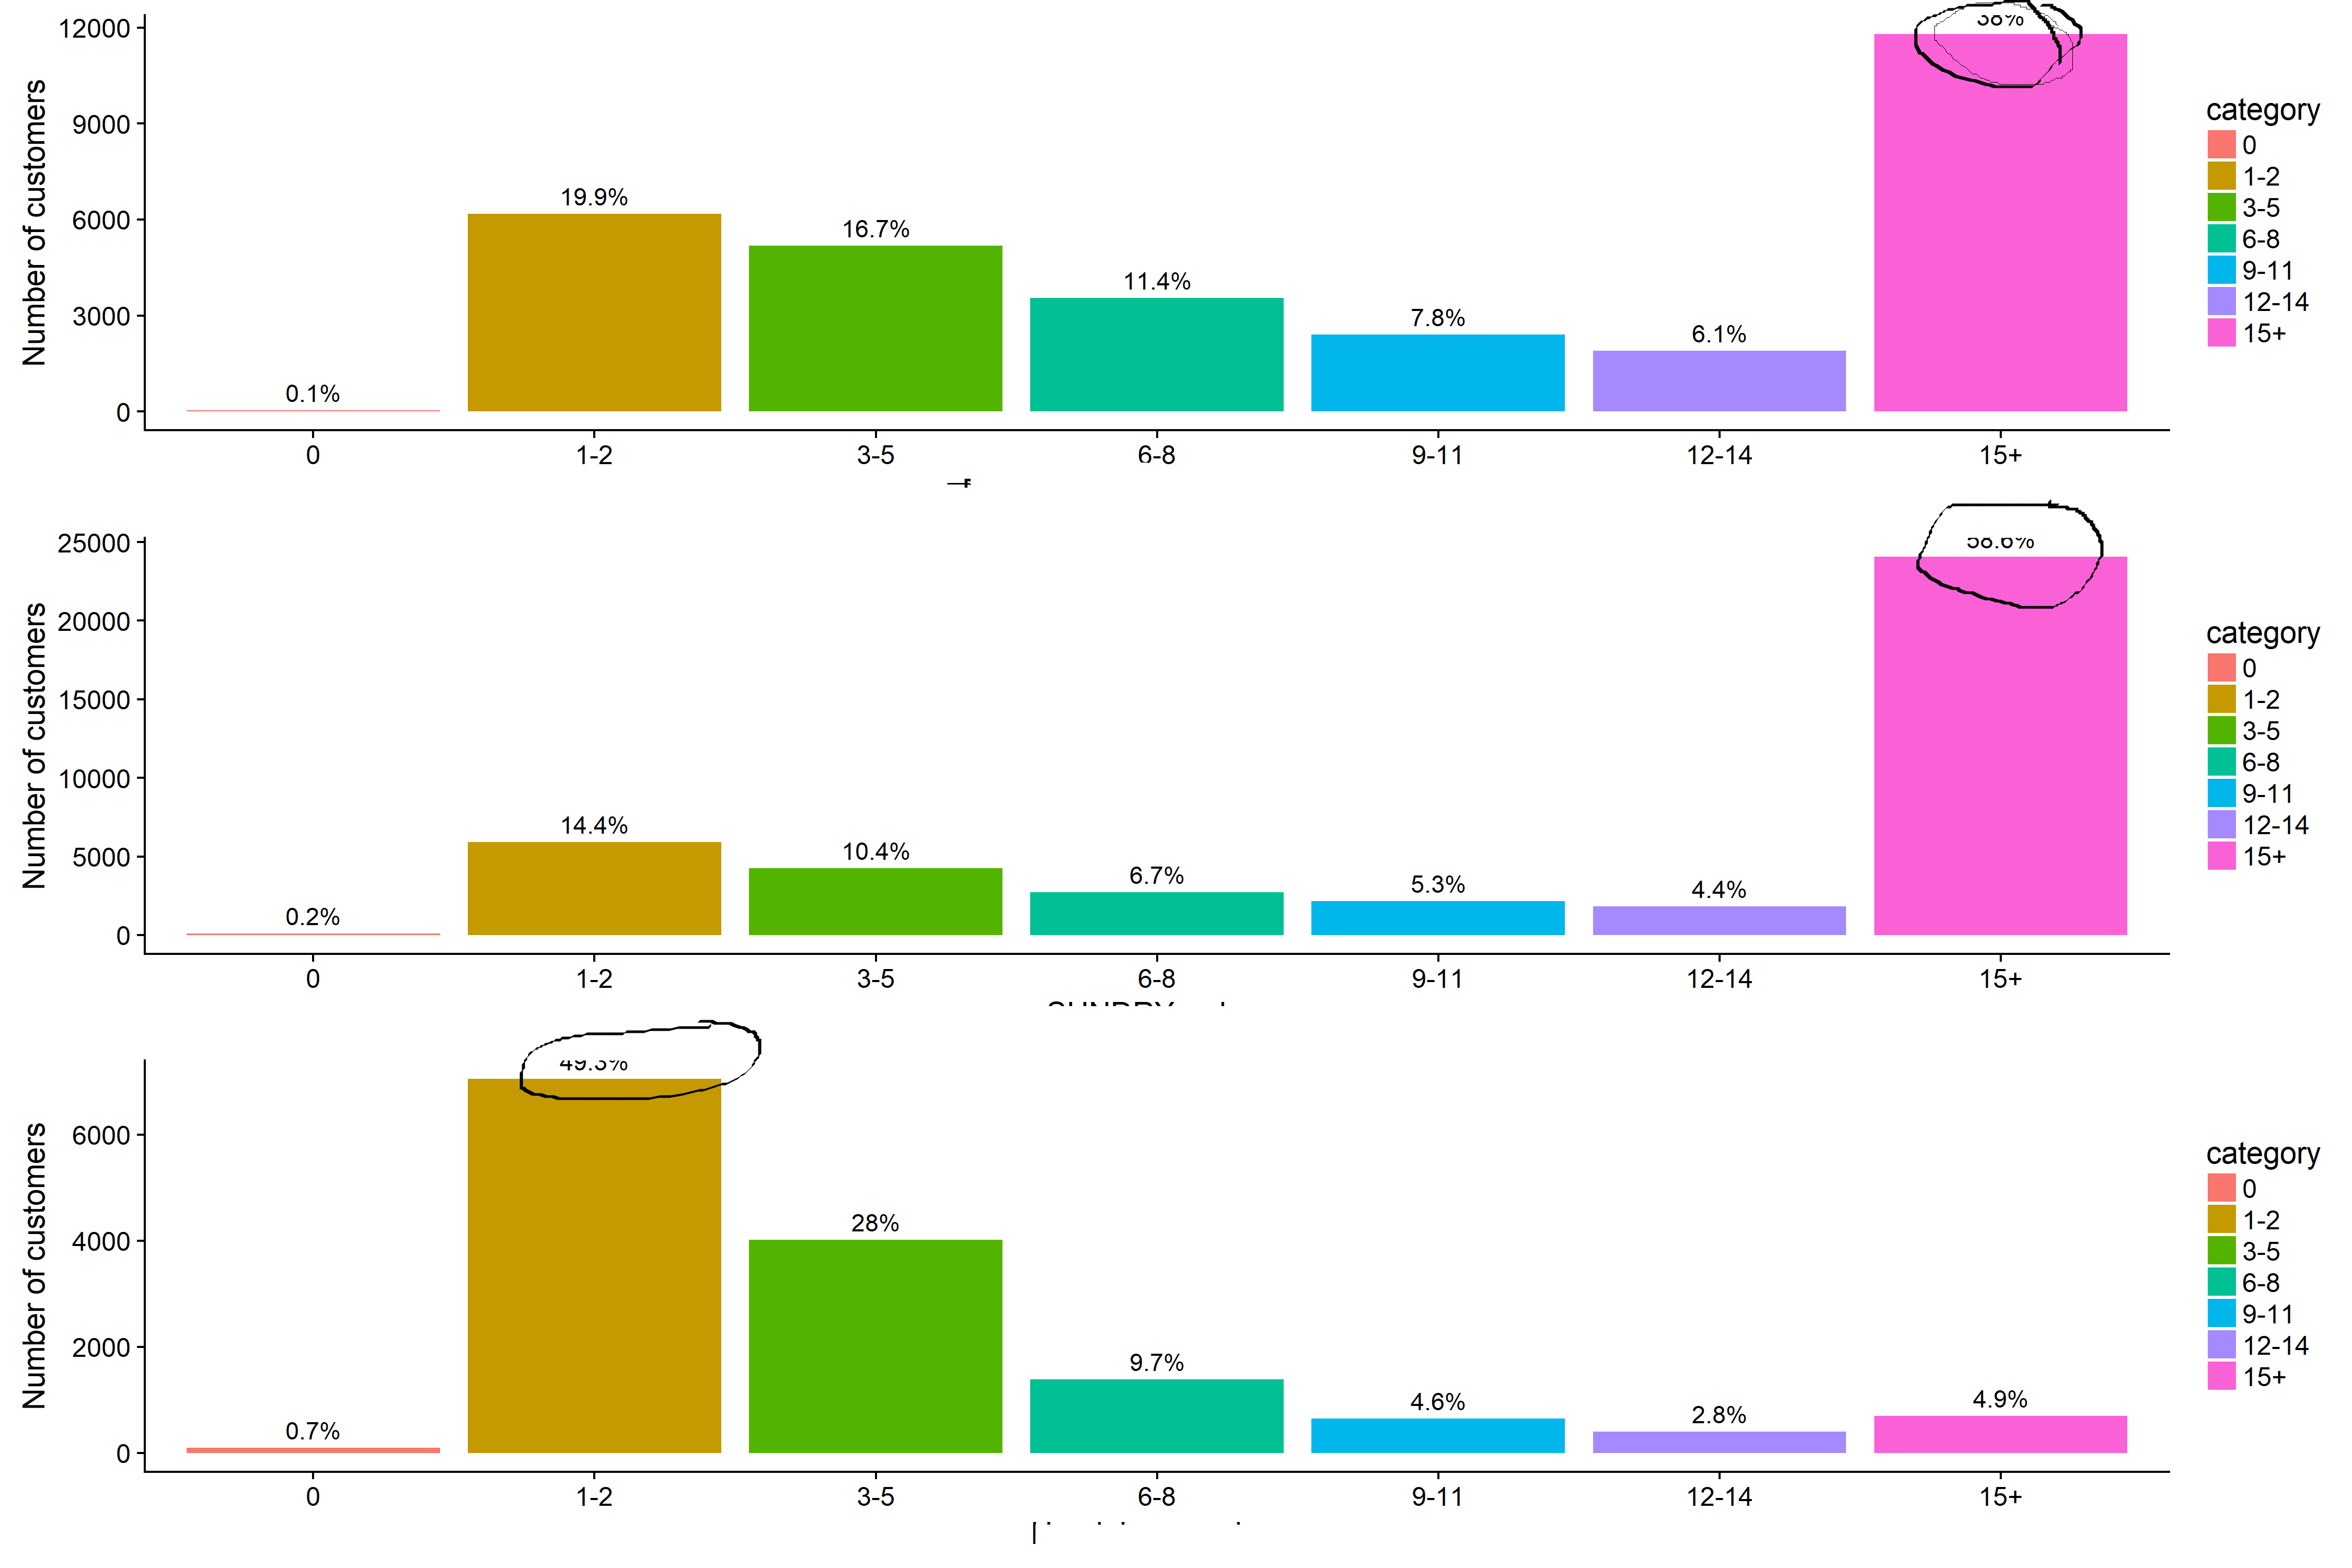
In my grid, some columns have a high percentage and the text gets cut off.
Is there a way to adjust that?
Thank you.
I can think of two options: 1) extend the y axis of your plots, 2) turn off clipping in coord_cartesian() (option 2 requires the development version of ggplot2). Here are examples of each
library("ggplot2")
library("cowplot")
#>
#> Attaching package: 'cowplot'
#> The following object is masked from 'package:ggplot2':
#>
#> ggsave
dat <- data.frame(x = c("A", "B"), y = c(10, 50))
p <- ggplot(dat, aes(x = x, y = y)) +
geom_bar(stat = "identity") +
geom_text(aes(label = x, y = y), vjust = -0.25)
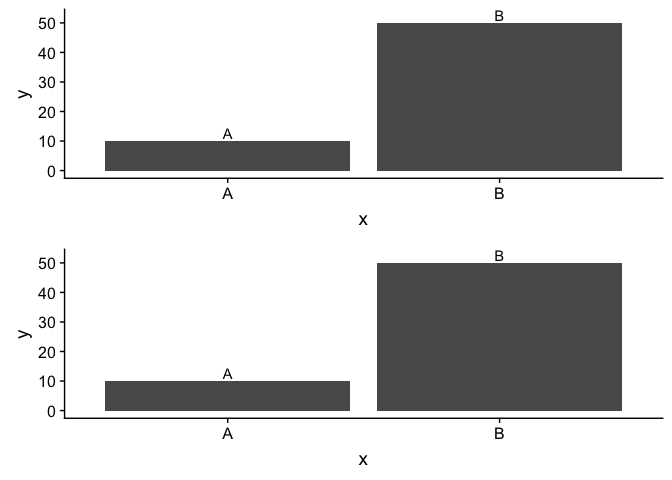
# Cut off
plot_grid(p, p, align = "v", ncol = 1, vjust = -0.8)

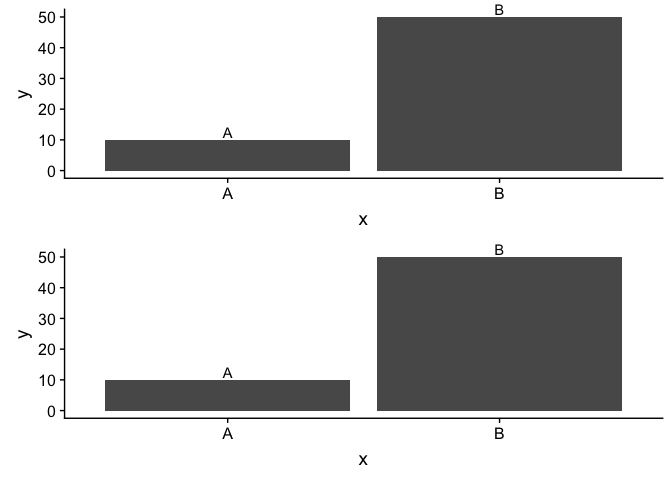
# Option 1
p1 <- p + ylim(c(0, 52))
plot_grid(p1, p1, align = "v", ncol = 1, vjust = -0.8)
# Option 2 -- requires development version of ggplot2
# devtools::install_github("tidyverse/ggplot2")
p2 <- p + coord_cartesian(clip = "off")
plot_grid(p2, p2, align = "v", ncol = 1, vjust = -0.8)
Created on 2018-06-18 by the reprex package (v0.2.0).
6 Likes