I'm customizing a table with the formattable package following the examples provided in this blog.
Basically, what I'm trying to do is set the values as percentage and then color them using the color_tile function.
Here's a reprex of my code:
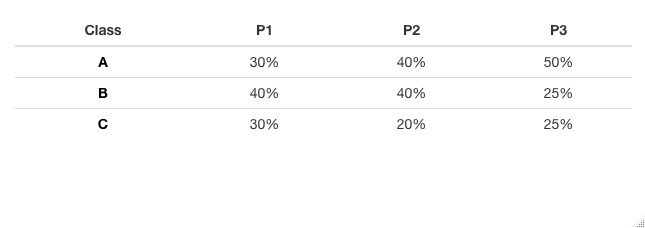
As you can see, I can set the values as percentages in the first table:
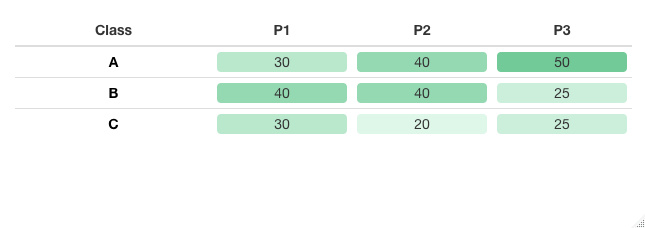
But when I try to color them, the percentages disappear as you can see in the second table:
So, my question is: what's the issue with my code?
Hi, it seems that the color_tile line supersedes the previous percent line. Is there a way of combining the two instructions (% and color) into a single function statement? Everything I've tried has failed.
If you switch them around, you get just the percent formatting and not the colouring:
library(formattable)
#>
#> Attaching package: 'formattable'
#> The following object is masked from 'package:crayon':
#>
#>     style

# my data
data <- data.frame(
  Class = c("A","B", "C"),
  P1 = c(30, 40, 30),
  P2 = c(40, 40, 20),
  P3 = c(50, 25, 25)
)

# And then color
formattable(data, align = c("c","c","c","c"),
            list(`Class` = formatter("span",
                                     style = ~ style(color = "black",
                                                     font.weight = "bold")),
                 area(col = 2:4) ~ color_tile("#DeF7E9", "#71CA97"),
                 area(col = 2:4) ~ function(x) percent(x / 100, digits = 0)))
Looks like this might be connected to this issue.
Have you tried installing the latest formattable from github?
Looks like the above issue was fixed some time ago in version 0.2.0.2 but the package author hasn't been able to get this version available on CRAN yet.