I am conducting an OLS regression panel data analysis with package PLM in R.
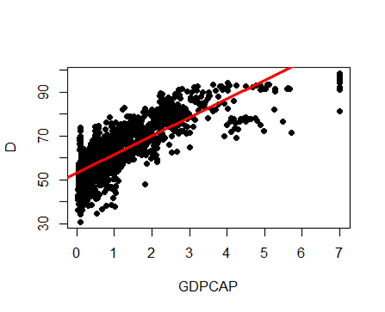
I use the following script to obtain a plot and fitting line of variables D and GDPCAP:
yhat <-ols$fitted
plot(mydata$GDPCAP, mydata$D, pch=19, xlab="GDPCAP", ylab="D")
abline(lm(mydata$D~mydata$G),lwd=3, col="red")
Is there any script that can fit a quadratic line as well as provide the quadratic equation coefficients of the line?
The following script fits a quadratic line in the plot (in blue):
quadratic_model <- lm(D ~ GDPCAP + I(GDPCAP^2), data = mydata)
order_id <- order(mydata$GDPCAP)
lines(x = mydata$GDPCAP[order_id],
      y = fitted(quadratic_model)[order_id],
      col = "blue",
      lwd = 2)
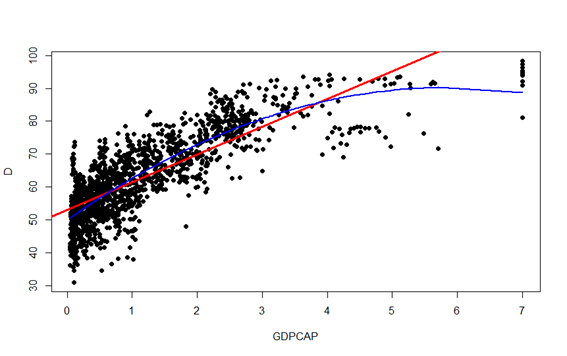
Coefficients of the quadratic equation are obtained as follows:
coeftest(quadratic_model, vcov. = vcovHC, type = "HC1")

t test of coefficients:

             Estimate Std. Error t value  Pr(>|t|)
(Intercept) 49.970827   0.310524 160.924 < 2.2e-16 ***
GDPCAP      13.790826   0.340038  40.557 < 2.2e-16 ***
I(GDPCAP^2) -1.180603   0.070727 -16.692 < 2.2e-16 ***
---
Signif. codes:  0 ‘***’ 0.001 ‘**’ 0.01 ‘*’ 0.05 ‘.’ 0.1 ‘ ’ 1
system
Closed
3
This topic was automatically closed 7 days after the last reply. New replies are no longer allowed.