Packages incompatibility with ggplotly

Hello,

Recently I've been trying to create a map for my Shiny Dashboard, and everything went fine with ggplot2. But I want to make my map interactive, so I've been reading about ggplotly and how everyone says it's such a simple way to switch from ggplot to plotly.

1st problem: after using the ggplotly, my map was not appearing in RStudio viewer so I thought it's not working. Apparently it is, but the interactive map can be viewed only in a separate window. It doesn't bother me that much but it shows that something is not going as it should.

2nd problem: of course, viewing it in my shiny dashboard is impossible. Note: the simple ggplot map works, but when I try ggplotly, nothing comes up. I thought that my syntax is wrong, and when I asked initially for help, somebody said that it works fine for him (he uses R version 3.5.0 , plotly_4.7.1.9000 ggplot2_2.2.1.9000 while I have R version 3.5.1., plotly v.4.8.0 and ggplot2 v 3.0.0.).
I immediately tried alot of options to fix this: installed plotly v4.7.1. and ggplot2 v.2.2.1. from CRAN (this worked for a bit. After i ran ggplotly, it showed the map both in the viewer and in shiny but shortly after something went wrong, i was asked to update shiny package and to use the dev version of ggplot2), i updated to dev versions to both ggplot & plotly, i tried to use R version 3.5.0 but there were alot of incompatibilities with other packages and now I am back to where I started.

My question: Do I have to mandatory use R 3.5.0 instead of 3.5.1? Should I use the dev older versions? If so, where do I find them because I've been searching all over. I think I went on messy paths & tried so many mixed options that I am not able to see any solution to this.

Any help is highly appreciated! Thank you!

My code
ui.R

library(shinydashboard)
library(shiny)
library(plotly)
library(ggplot2)


dashboardPage(
  dashboardHeader(),
  dashboardSidebar(

    sidebarMenu(
      sidebarSearchForm(textId = "searchbar", buttonId = "searchbtn", label = "Search..."),
      menuItem("Test", tabName="state", icon = icon("dashboard")))
  ),

  dashboardBody(
    tabItems(

      tabItem(tabName="state",
              fluidRow(
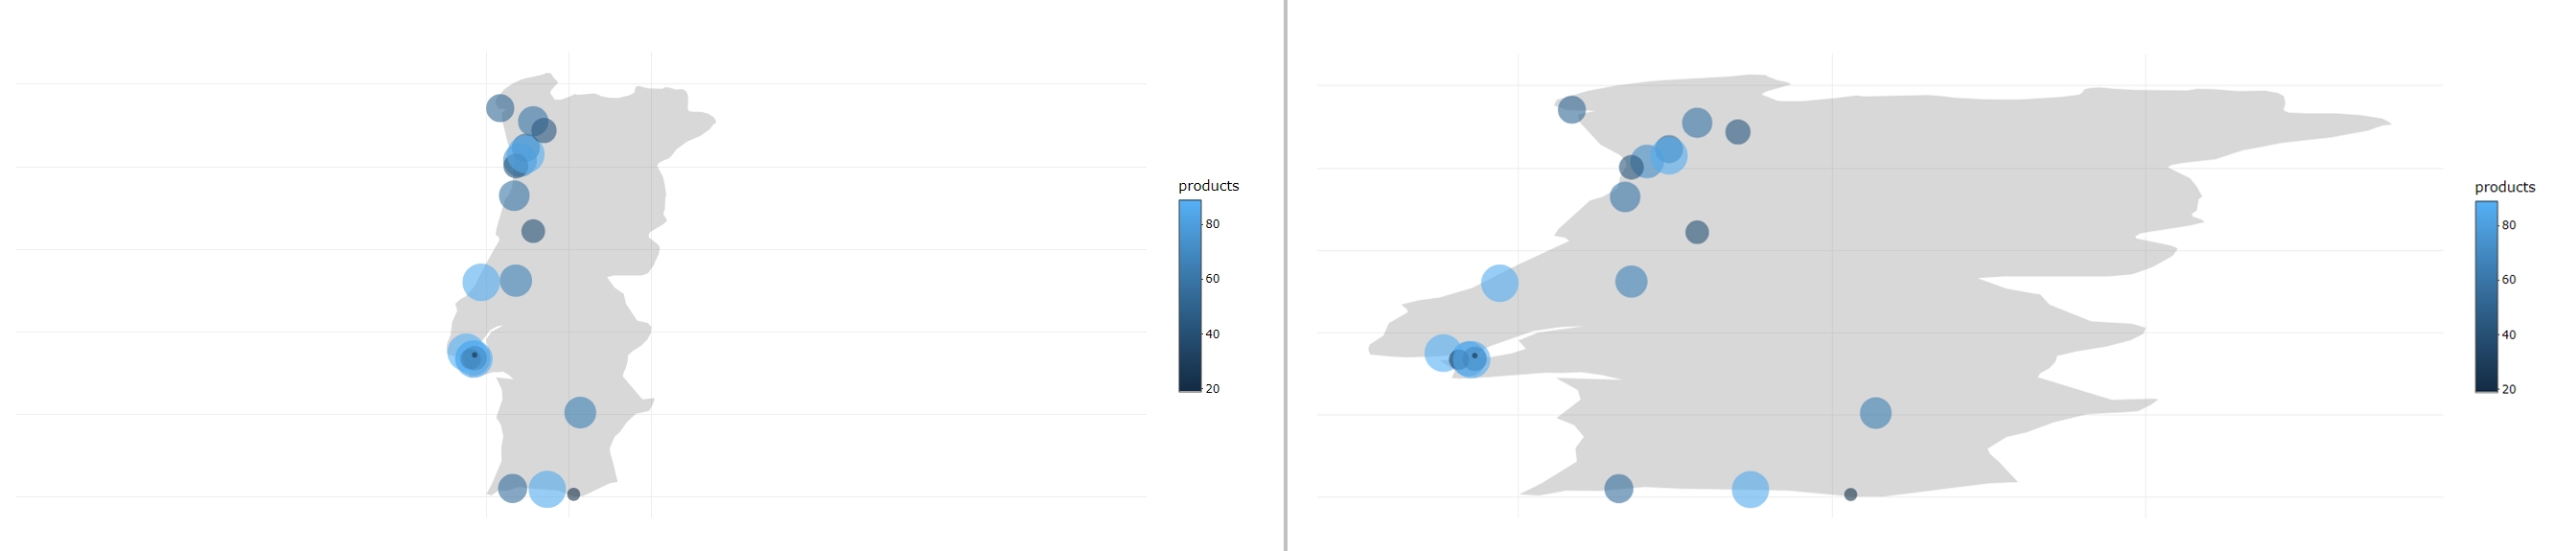
                box(title = "Products across the country", width = 12, status = "success", plotlyOutput("map01"))
              )
       )
    )
  )
)

server.R

library(shinydashboard)
library(shiny)
library(plotly)
library(ggplot2)

shinyServer(function(input, output) {

  world_map <- map_data("world")%>%filter(region=="Portugal")

  info = data.frame(read.csv("cities.csv", header = TRUE))

  dput(info)
  structure(list(name = structure(c(4L, 10L, 6L, 15L, 14L, 9L, 
  3L, 7L, 8L, 11L, 18L, 17L, 1L, 16L, 12L, 13L, 2L, 19L, 5L, 20L, 
  21L), .Label = c("Continente ID0912 - Espinho", "Continente ID8234 - 
  Guimaraes", "Continente ID9912 - Braga", "Continente ID9932 - Albufeira", 
  "Jumbo ID2441 - Lisbon", "Minipreco ID1120 - Almada", "Minipreco ID1150 - 
  Cacilhas", 
  "Minipreco ID1212 - Canelas", "Minipreco ID1231 - Beja", "Minipreco ID1332 
  - Alfena", "Minipreco ID5345 - Caparica", "Minipreco ID7772 - Fatima", 
  "Minipreco ID8723 - Gondomar", 
  "Minipreco ID8891 - Aveiro", "Pingodoce ID1002 - Amadora", "Pingodoce 
  ID4228 - Faro", "Pingodoce ID4778 - Cova da Piedade", "Pingodoce ID5426 - 
  Coimbra", "Pingodoce ID7734 - Lagos", "Pingodoce ID7734 - Nazare", 
  "Pingodoce ID9832 - Viana do Castelo"), class = "factor"), products = 
  c(86L, 53L, 77L, 89L, 61L, 65L, 60L, 43L, 72L, 34L, 41L, 88L, 44L, 23L, 
  67L, 87L, 45L, 56L, 19L, 
  87L, 53L), lat = c(37.09, 41.23, 38.68, 38.75, 40.65, 38.02, 
  41.55, 38.68, 41.08, 38.67, 40.22, 38.67, 41.01, 37.03, 39.62, 
  41.15, 41.44, 37.1, 38.72, 39.6, 41.71), long = c(-8.26, -8.52, 
  -9.16, -9.24, -8.66, -7.86, -8.43, -9.14, -8.59, -9.19, -8.43, 
  -9.15, -8.64, -7.94, -8.64, -8.52, -8.3, -8.68, -9.14, -9.06, 
  -8.83)), class = "data.frame", row.names = c(NA, -21L))

  output$map01<- renderPlotly({
    p = info %>% ggplot() + geom_polygon(data=world_map, aes(x=long, y=lat, group=group), fill="grey50", alpha=0.3) + geom_point(aes(x=long, y=lat, colour=products, size=products, group=name), alpha=0.6) + scale_size_continuous(range=c(1,10)) + theme_void() + coord_map() + guides(size=FALSE)
    ggplotly(p, tooltip = c("group","colour"))
  })  

})
1 Like

Small question about problem #1: what version of RStudio are you using? There was a previous report of plotly maps not displaying correctly that was solved by installing the RStudio 1.2 Preview release:

For question #2, thanks for providing an example! I’m not able to run your code at the moment, but will try to give it a go soon. In the meantime, I’m a little confused about what your current system setup is where the problem is still showing up. Can you please paste in the output of sessionInfo() from a session where you tried to run the shiny app locally?

R 3.5.0 was a major update with changes to R internals that make it necessary to re-install packages. The warnings about that can be confusing but it doesn’t mean the packages are incompatible with R 3.5.0.

2 Likes

Just another data point: on my Windows machine with R 3.5.0 and the latest CRAN versions of shiny, ggplot2, and plotly, your example works fine.

library(shiny)
library(plotly)
library(ggplot2)


world_map <- map_data("world") %>% filter(region=="Portugal")

info <- structure(list(name = structure(c(4L, 10L, 6L, 15L, 14L, 9L, 
  3L, 7L, 8L, 11L, 18L, 17L, 1L, 16L, 12L, 13L, 2L, 19L, 5L, 20L, 
  21L), .Label = c("Continente ID0912 - Espinho", "Continente ID8234 - 
    Guimaraes", "Continente ID9912 - Braga", "Continente ID9932 - Albufeira", 
    "Jumbo ID2441 - Lisbon", "Minipreco ID1120 - Almada", "Minipreco ID1150 - 
    Cacilhas", 
"Minipreco ID1212 - Canelas", "Minipreco ID1231 - Beja", "Minipreco ID1332 
    - Alfena", "Minipreco ID5345 - Caparica", "Minipreco ID7772 - Fatima", 
"Minipreco ID8723 - Gondomar", 
"Minipreco ID8891 - Aveiro", "Pingodoce ID1002 - Amadora", "Pingodoce 
    ID4228 - Faro", "Pingodoce ID4778 - Cova da Piedade", "Pingodoce ID5426 - 
    Coimbra", "Pingodoce ID7734 - Lagos", "Pingodoce ID7734 - Nazare", 
"Pingodoce ID9832 - Viana do Castelo"), class = "factor"), products = 
c(86L, 53L, 77L, 89L, 61L, 65L, 60L, 43L, 72L, 34L, 41L, 88L, 44L, 23L, 
67L, 87L, 45L, 56L, 19L, 
87L, 53L), lat = c(37.09, 41.23, 38.68, 38.75, 40.65, 38.02, 
41.55, 38.68, 41.08, 38.67, 40.22, 38.67, 41.01, 37.03, 39.62, 
41.15, 41.44, 37.1, 38.72, 39.6, 41.71), long = c(-8.26, -8.52, 
-9.16, -9.24, -8.66, -7.86, -8.43, -9.14, -8.59, -9.19, -8.43, 
-9.15, -8.64, -7.94, -8.64, -8.52, -8.3, -8.68, -9.14, -9.06, 
-8.83)), class = "data.frame", row.names = c(NA, -21L))


ui <- fluidPage(
  plotlyOutput("map01")
)

server <- function(input, output, session) {
  output$map01<- renderPlotly({
    p <- info %>% ggplot() + geom_polygon(data=world_map, aes(x=long, y=lat, group=group), fill="grey50", alpha=0.3) + geom_point(aes(x=long, y=lat, colour=products, size=products, group=name), alpha=0.6) + scale_size_continuous(range=c(1,10)) + theme_void() + coord_map() + guides(size=FALSE)
    ggplotly(p, tooltip = c("group","colour"))
  })  
}

shinyApp(ui, server)
2 Likes

Hi! Thank you so much for your reply! I've been trying different options with my code and I discovered that the problem seems to lie in coord_map(). After I removed it, the map appeared both in RStudio and in the shiny dashboard. The only problem now is that it's resizing the map and I have no idea how to substitute the properties of coord_map() - i attached pictures to illustrate the problem. I also installed RStudio 1.2 Preview release but it crashed everytime i tried to open the app.

1 Like

Hi! Thanks for your reply. I tried R 3.5.0 with the latest CRAN packages and I still have the same problem. Meanwhile I found a possible issue, which is coord_map(). Without it, I can view the map in both RStudio and shiny dashboard, but now my map is being resized and I am not sure how to fix it. I attached some photos on this post with both cases: with and without coord_map().

1 Like

coord_map() is necessary to make map data project correctly, and I don't think that trying to hack ggplot2 to replace it is going to be a fruitful path. There seems to be something wrong with your system setup that's ultimately causing these problems. As another data point, here's the slightly simplified code that @jcheng ran successfully also working correctly in an RStudio Cloud project:

The `sessionInfo()` for that example…
R version 3.5.0 (2018-04-23)
Platform: x86_64-pc-linux-gnu (64-bit)
Running under: Ubuntu 16.04.5 LTS

Matrix products: default
BLAS: /usr/lib/atlas-base/atlas/libblas.so.3.0
LAPACK: /usr/lib/atlas-base/atlas/liblapack.so.3.0

locale:
 [1] LC_CTYPE=C.UTF-8       LC_NUMERIC=C           LC_TIME=C.UTF-8        LC_COLLATE=C.UTF-8     LC_MONETARY=C.UTF-8   
 [6] LC_MESSAGES=C.UTF-8    LC_PAPER=C.UTF-8       LC_NAME=C              LC_ADDRESS=C           LC_TELEPHONE=C        
[11] LC_MEASUREMENT=C.UTF-8 LC_IDENTIFICATION=C   

attached base packages:
[1] stats     graphics  grDevices utils     datasets  methods   base     

other attached packages:
[1] bindrcpp_0.2.2 maps_3.3.0     plotly_4.8.0   ggplot2_3.0.0  shiny_1.1.0   

loaded via a namespace (and not attached):
 [1] Rcpp_0.12.18      pillar_1.3.0      compiler_3.5.0    later_0.7.3       plyr_1.8.4        bindr_0.1.1       tools_3.5.0      
 [8] digest_0.6.15     viridisLite_0.3.0 jsonlite_1.5      tibble_1.4.2      gtable_0.2.0      pkgconfig_2.0.1   rlang_0.2.1      
[15] rstudioapi_0.7    mapproj_1.2.6     crosstalk_1.0.0   yaml_2.2.0        withr_2.1.2       dplyr_0.7.6       httr_1.3.1       
[22] htmlwidgets_1.2   grid_3.5.0        tidyselect_0.2.4  glue_1.3.0        data.table_1.11.4 R6_2.2.2          tidyr_0.8.1      
[29] purrr_0.2.5       magrittr_1.5      scales_1.0.0      promises_1.0.1    htmltools_0.3.6   assertthat_0.2.0  mime_0.5         
[36] xtable_1.8-2      colorspace_1.3-2  httpuv_1.4.5      labeling_0.3      lazyeval_0.2.1    munsell_0.5.0     crayon_1.3.4

That shouldn't be happening, either. I don't think you ever said what sort of system you are running on, and what version of RStudio you are using (aside from the Preview that you tried). Can you provide some more information about your system?

  • RStudio Edition: (Desktop or Server)
  • RStudio Version:
  • OS Version:

sessionInfo()
R version 3.5.1 (2018-07-02)
Platform: x86_64-w64-mingw32/x64 (64-bit)
Running under: Windows >= 8 x64 (build 9200)

Matrix products: default

locale:
[1] LC_COLLATE=English_United States.1252 LC_CTYPE=English_United States.1252
[3] LC_MONETARY=English_United States.1252 LC_NUMERIC=C
[5] LC_TIME=English_United States.1252

attached base packages:
[1] stats graphics grDevices utils datasets methods base

other attached packages:
[1] lubridate_1.7.4 reshape2_1.4.3 bindrcpp_0.2.2 maps_3.3.0
[5] plotly_4.8.0 ggplot2_3.0.0 DT_0.4 flexdashboard_0.5.1.1
[9] RMySQL_0.10.15 DBI_1.0.0 shinyWidgets_0.4.3 shinydashboard_0.7.0
[13] shiny_1.1.0

loaded via a namespace (and not attached):
[1] tidyselect_0.2.4 purrr_0.2.5 colorspace_1.3-2 htmltools_0.3.6 viridisLite_0.3.0
[6] yaml_2.2.0 rlang_0.2.2 later_0.7.3 pillar_1.3.0 glue_1.3.0
[11] withr_2.1.2 plyr_1.8.4 bindr_0.1.1 stringr_1.3.1 munsell_0.5.0
[16] gtable_0.2.0 htmlwidgets_1.2 evaluate_0.11 knitr_1.20 httpuv_1.4.5
[21] crosstalk_1.0.0 Rcpp_0.12.18 xtable_1.8-3 promises_1.0.1 scales_1.0.0
[26] backports_1.1.2 jsonlite_1.5 mime_0.5 digest_0.6.16 stringi_1.1.7
[31] dplyr_0.7.6 grid_3.5.1 rprojroot_1.3-2 tools_3.5.1 magrittr_1.5
[36] lazyeval_0.2.1 tibble_1.4.2 crayon_1.3.4 tidyr_0.8.1 pkgconfig_2.0.2
[41] data.table_1.11.4 assertthat_0.2.0 rmarkdown_1.10 httr_1.3.1 rstudioapi_0.7
[46] R6_2.2.2 compiler_3.5.1

I use RStudio Desktop, Version 1.1.456.

Thanks! One more question: can you run this code (from the above post) successfully? Before you try this, make sure you're running a new R session with an empty Global Environment (I'd actually create a new shiny app in a new RStudio Project for testing this code):

library(shiny)
library(plotly)
library(ggplot2)


world_map <- map_data("world") %>% filter(region=="Portugal")

info <- structure(list(name = structure(c(4L, 10L, 6L, 15L, 14L, 9L, 
  3L, 7L, 8L, 11L, 18L, 17L, 1L, 16L, 12L, 13L, 2L, 19L, 5L, 20L, 
  21L), .Label = c("Continente ID0912 - Espinho", "Continente ID8234 - 
    Guimaraes", "Continente ID9912 - Braga", "Continente ID9932 - Albufeira", 
    "Jumbo ID2441 - Lisbon", "Minipreco ID1120 - Almada", "Minipreco ID1150 - 
    Cacilhas", 
"Minipreco ID1212 - Canelas", "Minipreco ID1231 - Beja", "Minipreco ID1332 
    - Alfena", "Minipreco ID5345 - Caparica", "Minipreco ID7772 - Fatima", 
"Minipreco ID8723 - Gondomar", 
"Minipreco ID8891 - Aveiro", "Pingodoce ID1002 - Amadora", "Pingodoce 
    ID4228 - Faro", "Pingodoce ID4778 - Cova da Piedade", "Pingodoce ID5426 - 
    Coimbra", "Pingodoce ID7734 - Lagos", "Pingodoce ID7734 - Nazare", 
"Pingodoce ID9832 - Viana do Castelo"), class = "factor"), products = 
c(86L, 53L, 77L, 89L, 61L, 65L, 60L, 43L, 72L, 34L, 41L, 88L, 44L, 23L, 
67L, 87L, 45L, 56L, 19L, 
87L, 53L), lat = c(37.09, 41.23, 38.68, 38.75, 40.65, 38.02, 
41.55, 38.68, 41.08, 38.67, 40.22, 38.67, 41.01, 37.03, 39.62, 
41.15, 41.44, 37.1, 38.72, 39.6, 41.71), long = c(-8.26, -8.52, 
-9.16, -9.24, -8.66, -7.86, -8.43, -9.14, -8.59, -9.19, -8.43, 
-9.15, -8.64, -7.94, -8.64, -8.52, -8.3, -8.68, -9.14, -9.06, 
-8.83)), class = "data.frame", row.names = c(NA, -21L))


ui <- fluidPage(
  plotlyOutput("map01")
)

server <- function(input, output, session) {
  output$map01<- renderPlotly({
    p <- info %>% ggplot() + geom_polygon(data=world_map, aes(x=long, y=lat, group=group), fill="grey50", alpha=0.3) + geom_point(aes(x=long, y=lat, colour=products, size=products, group=name), alpha=0.6) + scale_size_continuous(range=c(1,10)) + theme_void() + coord_map() + guides(size=FALSE)
    ggplotly(p, tooltip = c("group","colour"))
  })  
}