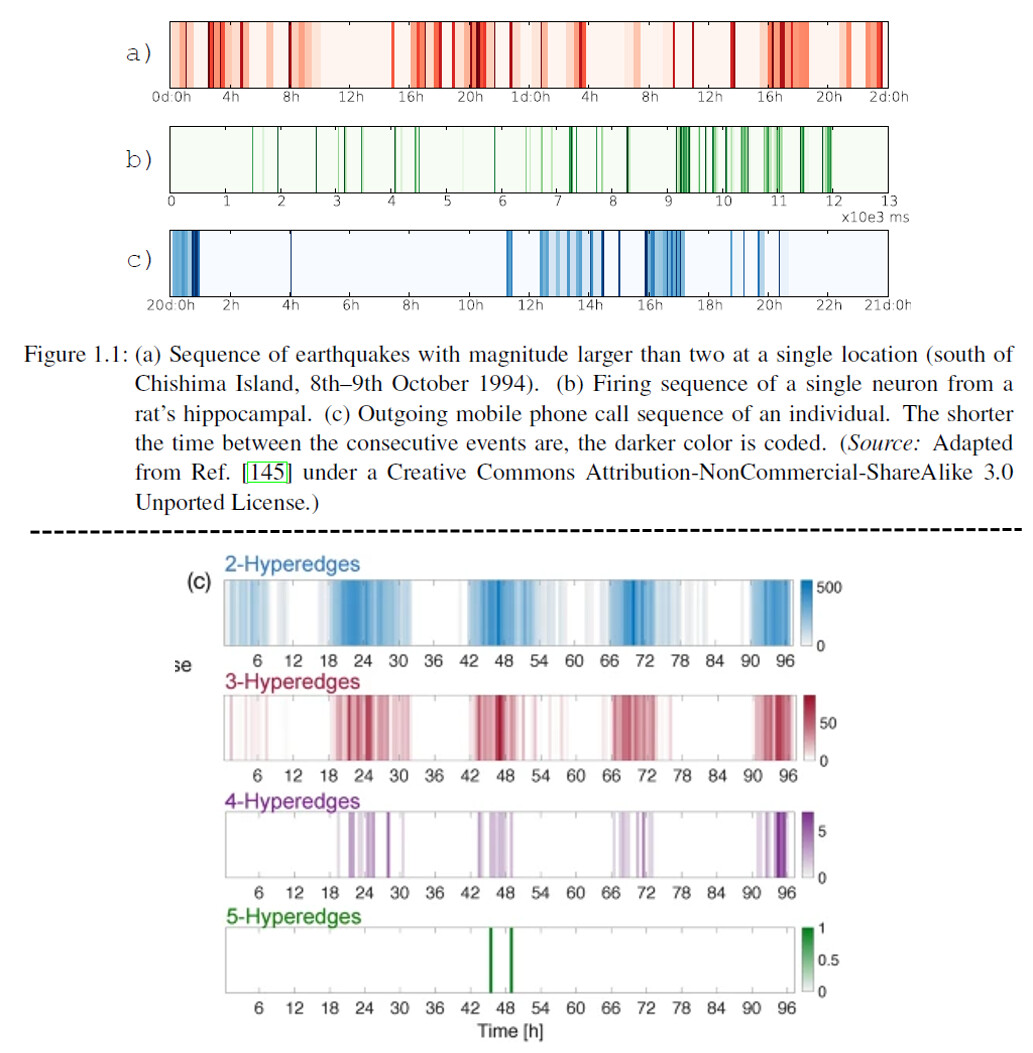
(Taken from Karsai et al., 2018 and Cencetti et al., 2021)
Do you have any idea whether a package like this exists in R? I am not quite sure how to call these types of plots but they show events of a time series and the color indicates how much time between consecutive events passes (the darker, the quicker the succession of events).
I always call these barcode plots (though I don't think that's an official name). You may see them more often as "rug plots" in the margins of other plots.
The blog post here uses this style (though not separated out into variables by colour), I would think you could adapt it by using facet_wrap() or similar: https://pmbarks.com/2019/canada-temp-trends/
Example from post: