I have the following code
hist(rbinon(n_repeats,100.0.5))
This gives me a histogram of my simulated data. I would like to be able to overlay a normal distribution on top to show how good the approximation is.
I have the following code
hist(rbinon(n_repeats,100.0.5))
This gives me a histogram of my simulated data. I would like to be able to overlay a normal distribution on top to show how good the approximation is.
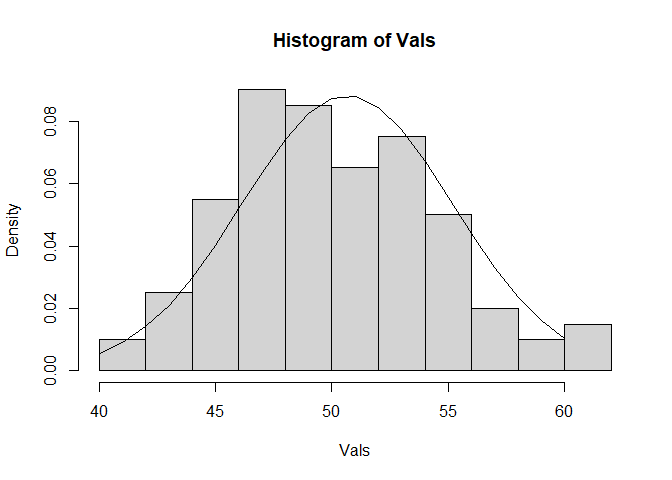
The hist() function will plot the probability density if you set the frequency argument to FALSE. You can then easily overlay a normal distribution.
n_repeats <- 100
set.seed(123)
Vals <- rbinom(n_repeats,100,0.5)
hist(Vals,freq = FALSE)

X_vals <- seq(40,60,1)
lines(X_vals,dnorm(X_vals,mean = mean(Vals),sd=sd(Vals)))
Created on 2022-09-28 with reprex v2.0.2
This topic was automatically closed 7 days after the last reply. New replies are no longer allowed.
If you have a query related to it or one of the replies, start a new topic and refer back with a link.