Overlapping datapoints in ggplot

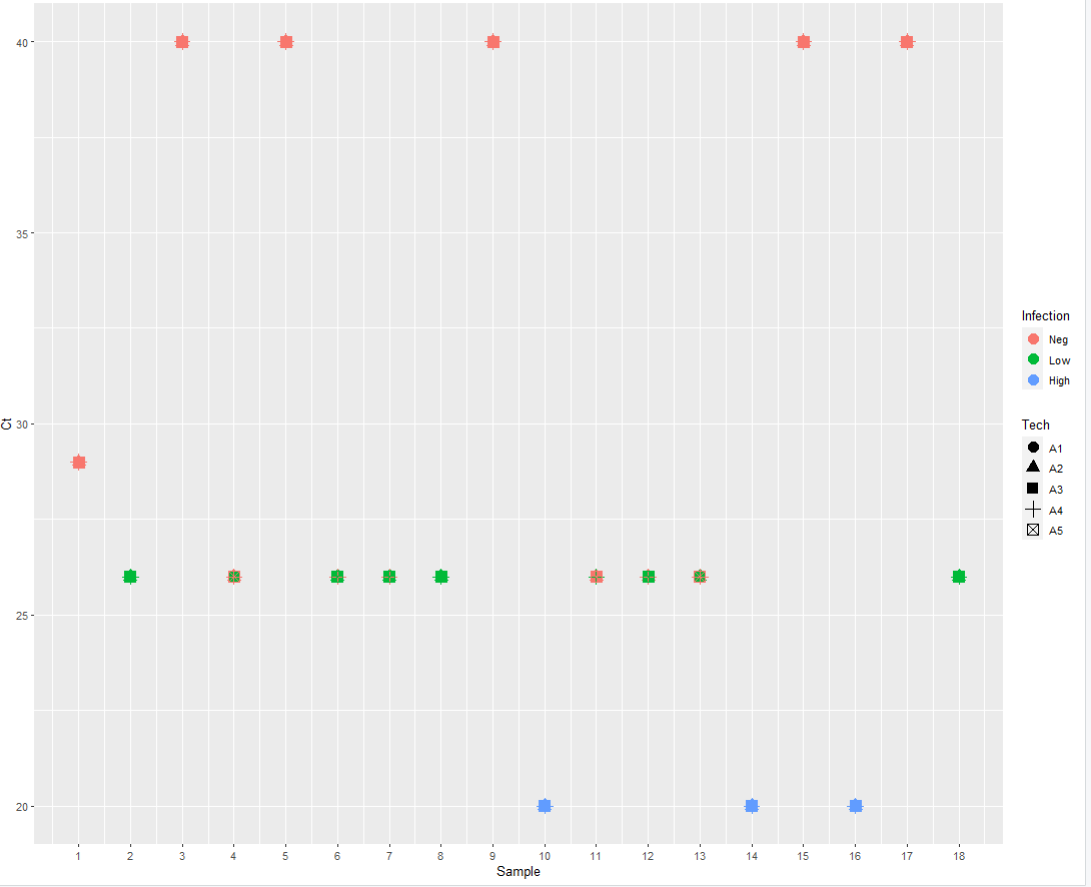
Hi R community - I am plotting a ggplot and would like to horizontally and/or vertically align and/or stack the overlapping data point. I used a couple of different library and position=position_jitter() but looks like I am missing something. Can anyone in the team help me figure out this

My code:

ggplot(s, aes(x = Sample, y = Ct, color = Infection, shape = Tech)) + geom_point(size = 4) + scale_x_continuous(n.breaks = 18, limits = c(1, 18))

Outcome:

Fail attempts:
code ggplot(s, aes(x = Sample, y = Ct, color = Tech, shape = Infection)) + geom_point(size = 4, position=position_jitter(h=0.01,w=8)) + scale_x_continuous(n.breaks = 18, limits = c(1, 18))

outcome

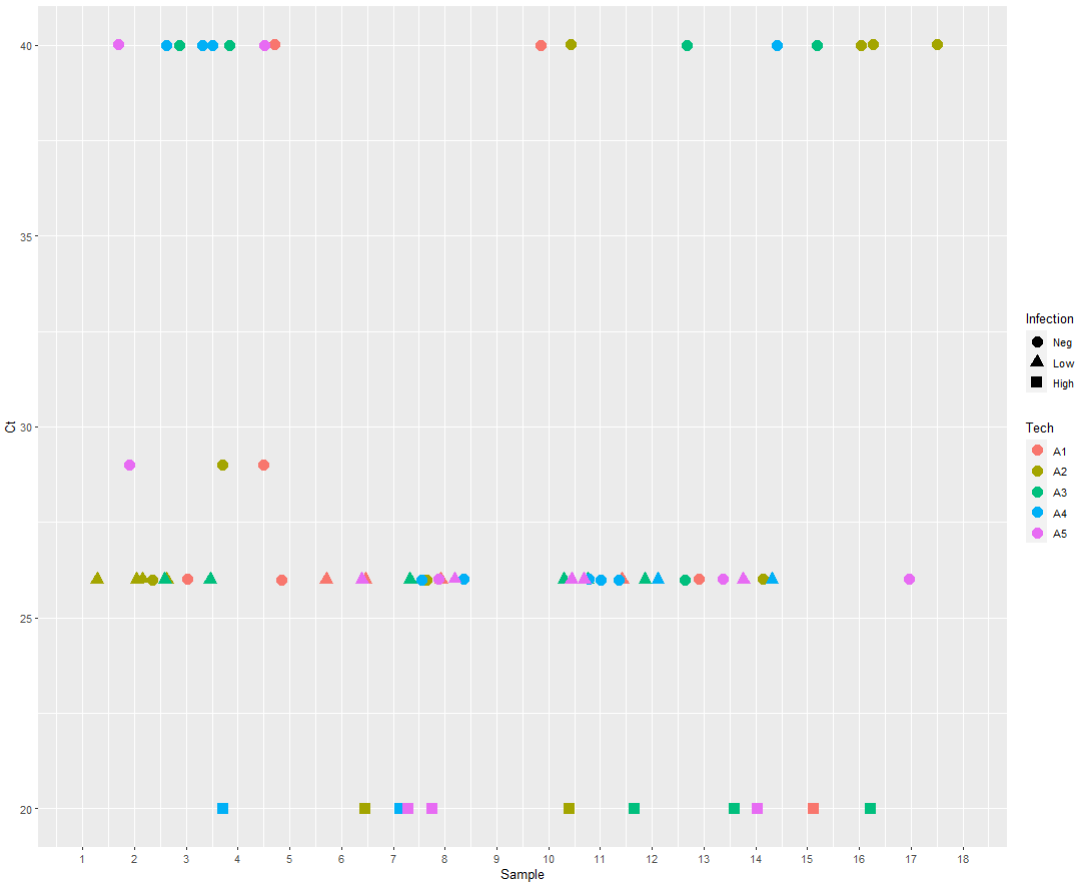
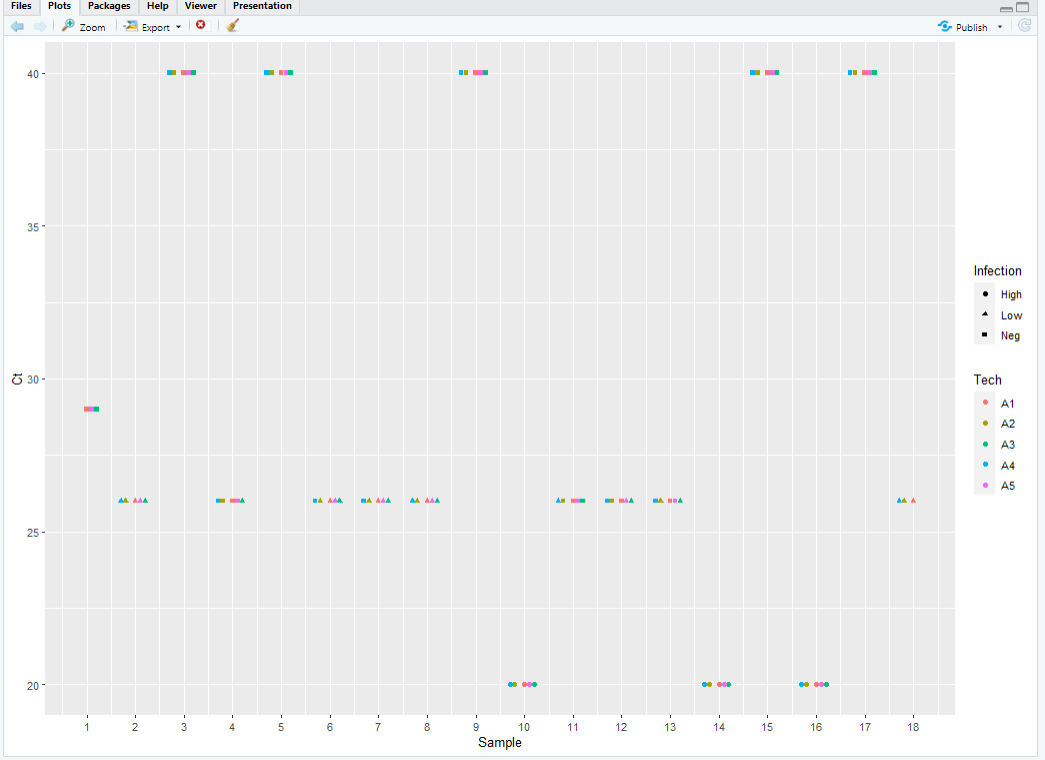
Your width setting for the jitter is very large. I doubt you can make the width jitter small enough to preserve the obvious assignment to the sample yet make the points distinguishable. Have you considered faceting by Technician? To do that, add

+ facet_wrap(~Tech)

to your code. Does that look better?

Hi again @FJCC - I do managed the visual (attached below) using library (ggbeeswarm), I would like to veritically alin the datapoints

Code:
ggplot(s, aes(x = Sample, y = Ct, color = Tech, shape = Infection)) + scale_x_continuous(n.breaks = 18, limits = c(1, 18)) + geom_quasirandom()

Visual:

This topic was automatically closed 42 days after the last reply. New replies are no longer allowed.

If you have a query related to it or one of the replies, start a new topic and refer back with a link.