Overlap image and textOutput - shiny

Hi!
I'm traying to put the text of a textOutput in front of an image to simulate that the image has a counter.
like this

This is my code so far

library(shiny)

# Define UI
ui <- fluidPage(

  # Application title
  titlePanel("Count"),

  # Sidebar
  sidebarLayout(
    sidebarPanel(
      textInput("txt", "Enter the text to display below:")
    ),

    # Show an image with a counter
    mainPanel(
      fluidRow(
        column(
          12,
          div(
            img(
              src = "copa.jpg", # any image
              height = 100,
              width = 100,
              style = "
                   margin-left:36%;
                    display: inline-block;
                    position: relative;
                "
            ),
            span(textOutput("default"),
              style = "
                position: absolute;
              color: orange;"
            )
          )
        )
      )
    )
  )
)

# Define server logic required to draw a histogram
server <- function(input, output) {

  output$default <- renderText({
    input$txt
  })

}

# Run the application
shinyApp(ui = ui, server = server)

I did some research in internet and I found that having position "absolut" and "relative" should be working but its not happening.

goblet image if needed it
copa

Thank you in advance for your help!

library(shiny)

# Define UI
ui <- fluidPage(

  # Application title
  titlePanel("Count"),

  # Sidebar
  sidebarLayout(
    sidebarPanel(
      textInput("txt", "Enter the text to display below:",
        value = 52
      )
    ),
    # Show an image with a counter
    mainPanel(
      fluidRow(
        column(
          12,
          div(
            style = "
                   margin-left:36%;
                    display: inline-block;
                    position: absolute;
                ",
            img(
              src = "https://forum.posit.co/uploads/default/original/3X/5/1/51436f1a309c3aaeb71f5f580182029f2733a301.jpeg",
              height = 100,
              width = 100,
              style = "  position: relative;"
            ),
            span(textOutput("default"),
              style = "
              color: orange;
                 position: relative;
                     top: -80px;
                    right: -40px;"
            )
          )
        )
      )
    )
  )
)

# Define server logic required to draw a histogram
server <- function(input, output) {
  output$default <- renderText({
    input$txt
  })
}

# Run the application
shinyApp(ui = ui, server = server)
2 Likes

Thank you so much! This is perfect!

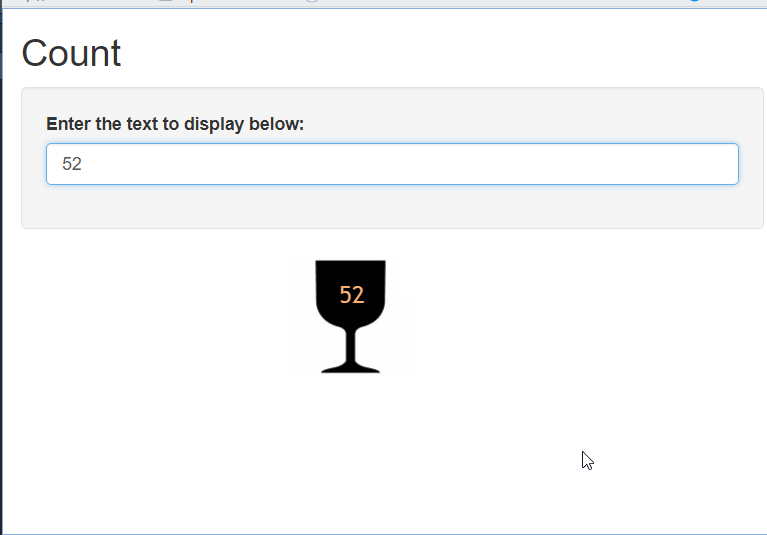
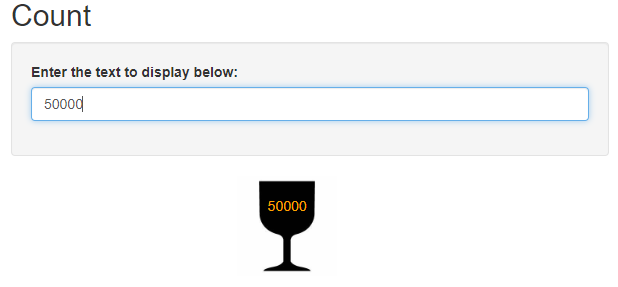
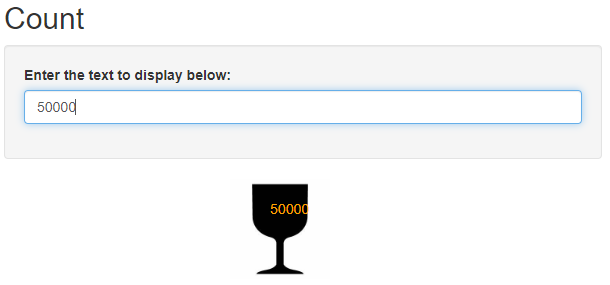
One slight modification I'd make to @nirgrahamuk 's excellent response would be to specify text-align: center; for the div() and the textOutput(), which will help if values are longer than a couple of characters (which may not be the case). This also requires the textOutput() width to be set to match the width of the image. Updated code below.

library(shiny)

# Define UI
ui <- fluidPage(
  
  # Application title
  titlePanel("Count"),
  
  # Sidebar
  sidebarLayout(
    sidebarPanel(
      textInput("txt", "Enter the text to display below:",
                value = 52
      )
    ),
    # Show an image with a counter
    mainPanel(
      fluidRow(
        column(
          12,
          div(
            style = "
                   margin-left:36%;
                    display: inline-block;
                    text-align: center;
                    position: absolute;
                ",
            img(
              src = "https://forum.posit.co/uploads/default/original/3X/5/1/51436f1a309c3aaeb71f5f580182029f2733a301.jpeg",
              height = 100,
              width = 100,
              style = "  position: relative;"
            ),
            span(textOutput("default"),
                 style = "
              color: orange;
                 position: relative;
                 text-align: center;
                 width: 100px;
                 top: -80px;
                 "
            )
          )
        )
      )
    )
  )
)

# Define server logic required to draw a histogram
server <- function(input, output) {
  output$default <- renderText({
    input$txt
  })
}

# Run the application
shinyApp(ui = ui, server = server)

With text-align: center:
image

Without
image

2 Likes

This topic was automatically closed 7 days after the last reply. New replies are no longer allowed.

If you have a query related to it or one of the replies, start a new topic and refer back with a link.