There is no need to include your whole dataset on a minimal reproducible example, a representative sample (subset) of your data, that reproduces your issue would be enough.
For example, I'm going to make a reprex for my proposed solution using the iris built-in dataset.
library(dplyr)
library(ggplot2)
# Custom outlier function
is_outlier <- function(x) {
return(x < quantile(x, 0.25) - 1.5 * IQR(x) | x > quantile(x, 0.75) + 1.5 * IQR(x))
}
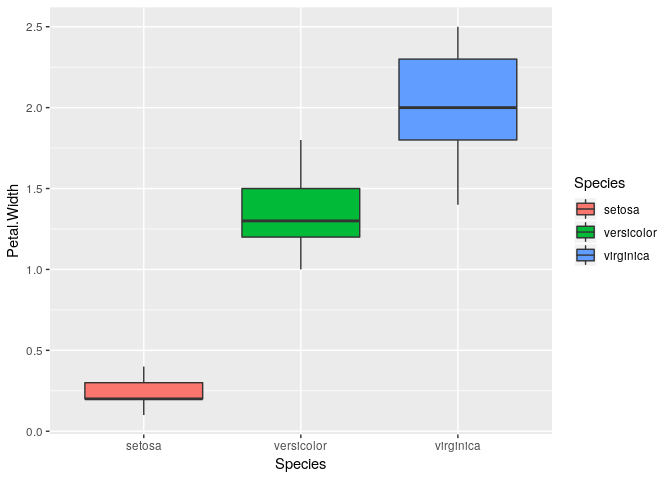
iris %>%
select(Petal.Width, Species) %>%
group_by(Species) %>%
mutate(outlier = is_outlier(Petal.Width)) %>%
filter(outlier == FALSE) %>%
ggplot(aes(Species, Petal.Width, fill = Species)) +
geom_boxplot()