Dear all,
I would like to order the difference values in my data from small to large inside facet_wrap() where each panel has its own distinct order.
Here is my code so far:
  all_var_apx  %>%
ggplot(aes(x = fct_reorder(test_group, (difference)), y = difference, ymin = bca_ci_low, ymax = bca_ci_high, color=Voicing)) +
  geom_linerange() +
  geom_pointrange() +   geom_hline(yintercept = 0, color="red") + theme_classic() + facet_wrap(~var)
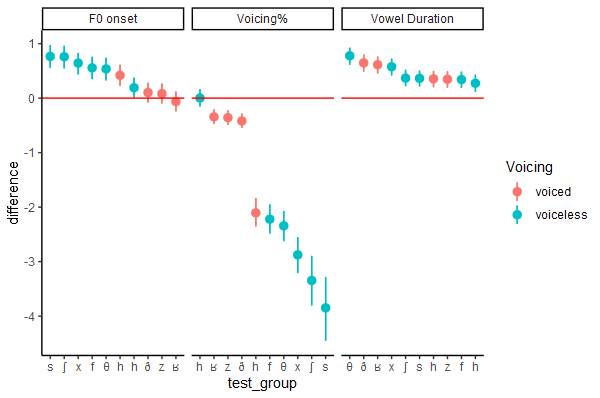
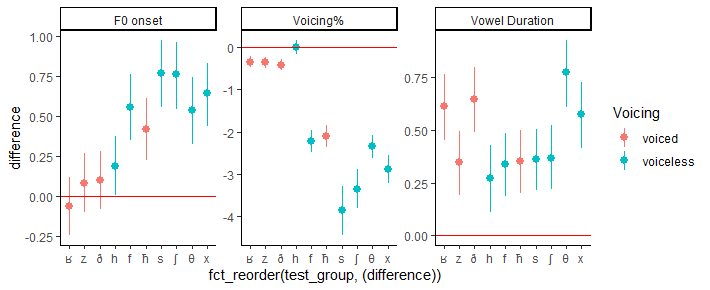
And this is the plot it generates. But as you can see the variables in the x-axis are not ordered from the absolute small value to the absolute large value. Can anybody help with this?
structure(list(test_group = c("h", "f", "z", "h", "s", "<U+0283>",
"x", "<U+0281>", "ð", "<U+03B8>", "<U+0281>", "z", "ð", "h",
"h", "<U+03B8>", "f", "x", "<U+0283>", "s", "s", "<U+0283>",
"x", "<U+03B8>", "f", "h", "ð", "z", "<U+0281>", "h"), difference = c(0.272691564814319,
0.339931546656402, 0.345996113077329, 0.354535171324727, 0.362621169240718,
0.367580705327884, 0.5754295620242, 0.613440561574917, 0.646192417770898,
0.776138550758279, -0.0645623054734185, 0.082531132154056, 0.102864717559747,
0.190600313191994, 0.417716450084091, 0.536223093807613, 0.555075763700829,
0.64273792090886, 0.759383477065518, 0.765388832447911, -3.84763253425232,
-3.34528528281513, -2.87543239150845, -2.34264963208893, -2.22040363947979,
-2.10496258366143, -0.418858000905252, -0.358339808304275, -0.343672706878961,
0.00252449573965998), bca_ci_low = c(0.112455747226839, 0.188335588495741,
0.191200575194077, 0.198773843491607, 0.214503814253224, 0.218609323460334,
0.415618428377502, 0.452921016355907, 0.488342826235787, 0.610328958916321,
-0.244606050086718, -0.0970408020409381, -0.0820052841470037,
0.00573409308324146, 0.225425159762901, 0.323924429626786, 0.347832261872867,
0.435785367456719, 0.544815140054194, 0.55688103033135, -4.44986472394159,
-3.80417839820399, -3.21011745721127, -2.62319542702839, -2.48041125128384,
-2.35503330627727, -0.546897194258833, -0.489328481435092, -0.472930247192843,
-0.152257482905314), bca_ci_high = c(0.43024234461714, 0.486239940911359,
0.493605391534663, 0.49937323094591, 0.505526460420473, 0.5211742300352,
0.725430619337547, 0.76585592921834, 0.799160524200348, 0.925224604110868,
0.119328545887156, 0.267715365976688, 0.28271403914918, 0.376619493617134,
0.615076649272382, 0.741817147277846, 0.758730776718758, 0.82947433902177,
0.960811509289517, 0.972557228613845, -3.28491296872177, -2.89427154950001,
-2.54733248007305, -2.06981566188459, -1.95046918808833, -1.83259017408631,
-0.284514289520204, -0.221035064316569, -0.207041695710978, 0.164168014972509
), Voicing = c("voiceless", "voiceless", "voiced", "voiced",
"voiceless", "voiceless", "voiceless", "voiced", "voiced", "voiceless",
"voiced", "voiced", "voiced", "voiceless", "voiced", "voiceless",
"voiceless", "voiceless", "voiceless", "voiceless", "voiceless",
"voiceless", "voiceless", "voiceless", "voiceless", "voiced",
"voiced", "voiced", "voiced", "voiceless"), var = c("Vowel Duration",
"Vowel Duration", "Vowel Duration", "Vowel Duration", "Vowel Duration",
"Vowel Duration", "Vowel Duration", "Vowel Duration", "Vowel Duration",
"Vowel Duration", "F0 onset", "F0 onset", "F0 onset", "F0 onset",
"F0 onset", "F0 onset", "F0 onset", "F0 onset", "F0 onset", "F0 onset",
"Voicing%", "Voicing%", "Voicing%", "Voicing%", "Voicing%", "Voicing%",
"Voicing%", "Voicing%", "Voicing%", "Voicing%")), class = c("grouped_df",
"tbl_df", "tbl", "data.frame"), row.names = c(NA, -30L), groups = structure(list(
    test_group = c("<U+0281>", "<U+0283>", "<U+03B8>", "ð", "f",
    "h", "h", "s", "x", "z"), .rows = structure(list(c(8L, 11L,
    29L), c(6L, 19L, 22L), c(10L, 16L, 24L), c(9L, 13L, 27L),
        c(2L, 17L, 25L), c(1L, 14L, 30L), c(4L, 15L, 26L), c(5L,
        20L, 21L), c(7L, 18L, 23L), c(3L, 12L, 28L)), ptype = integer(0), class = c("vctrs_list_of",
    "vctrs_vctr", "list"))), class = c("tbl_df", "tbl", "data.frame"
), row.names = c(NA, -10L), .drop = TRUE))